r4films
厳選コレクション
Stock charts
(838)
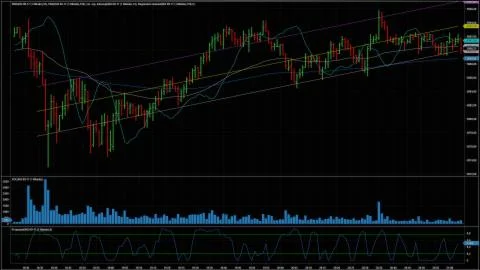
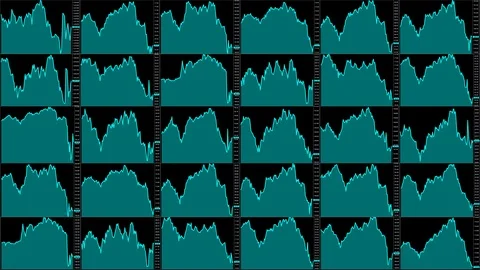
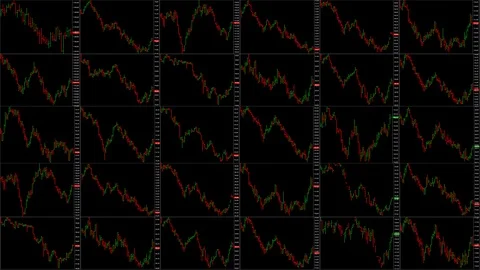
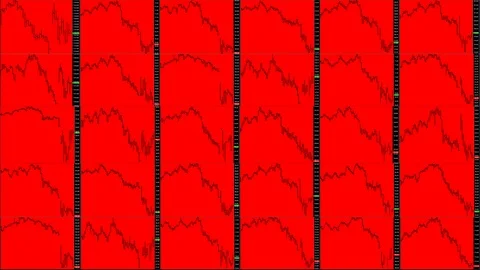
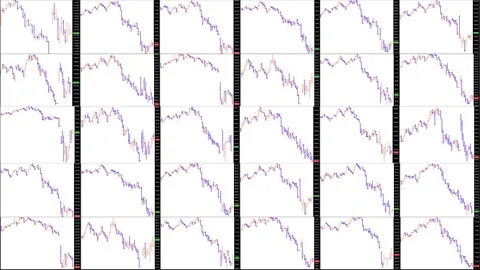
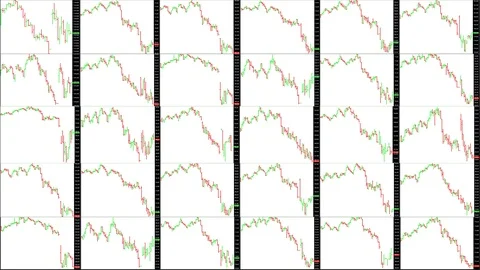
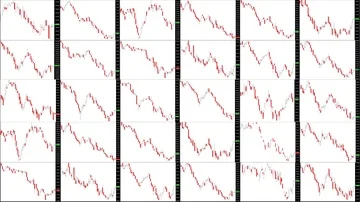
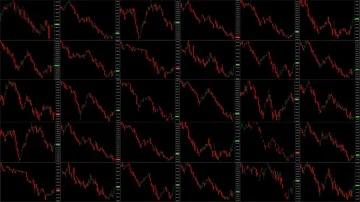
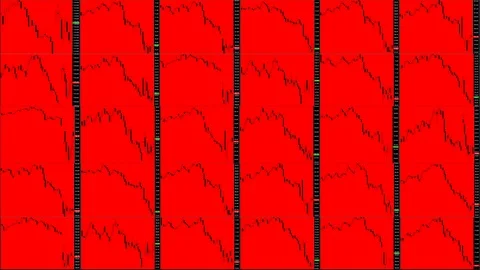
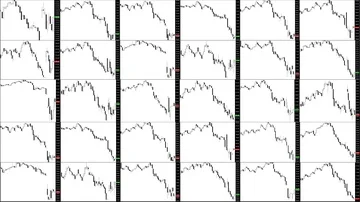
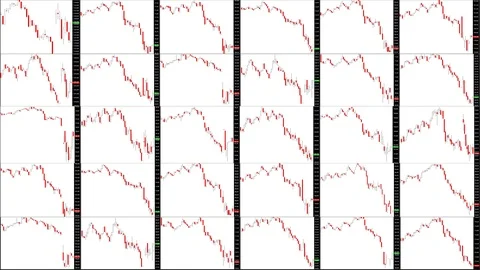
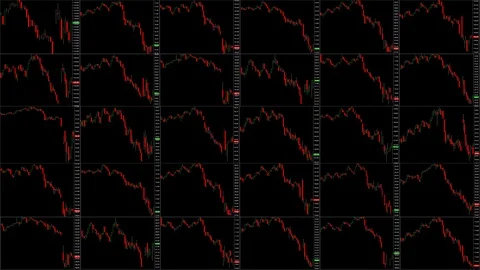
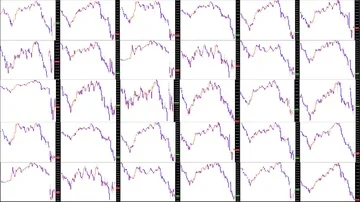
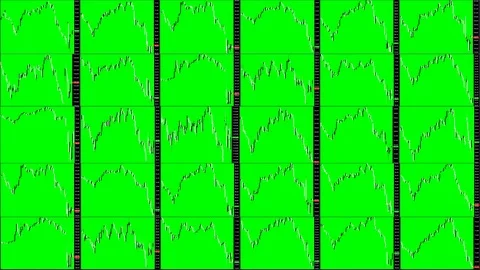
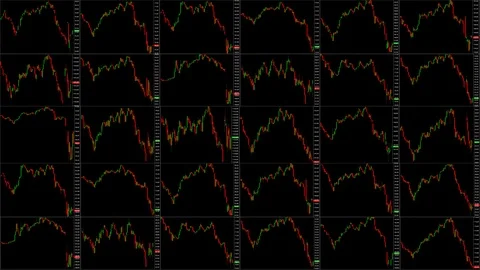
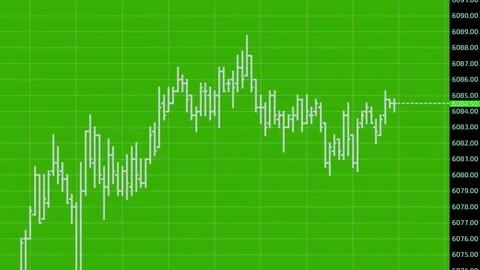
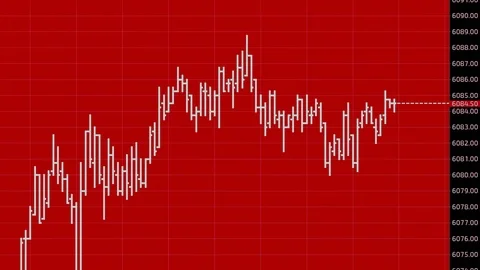
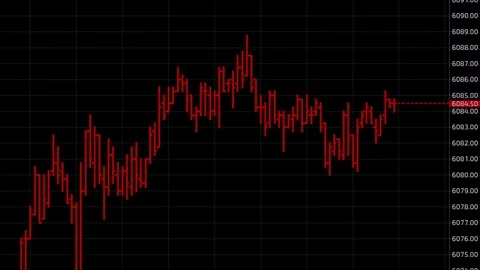
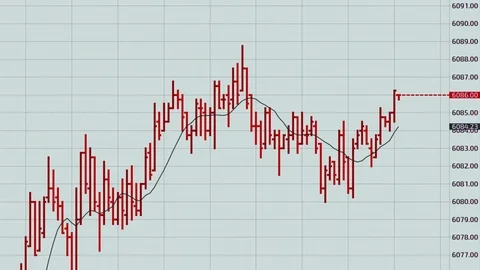
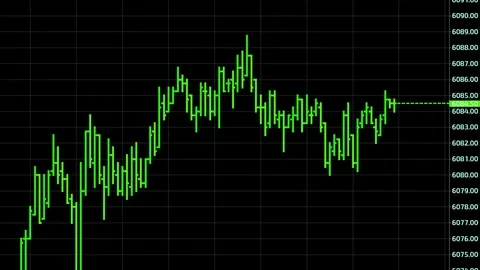
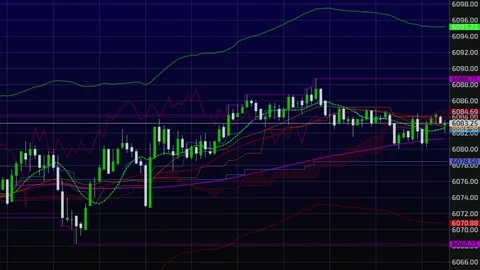
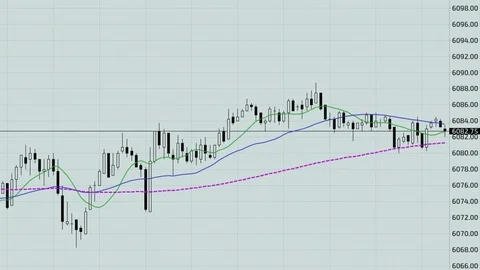
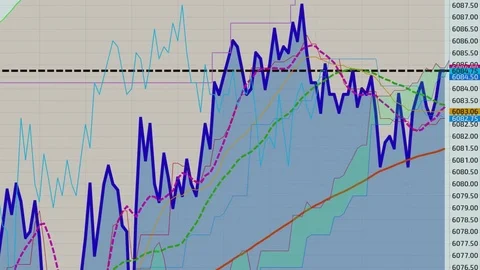
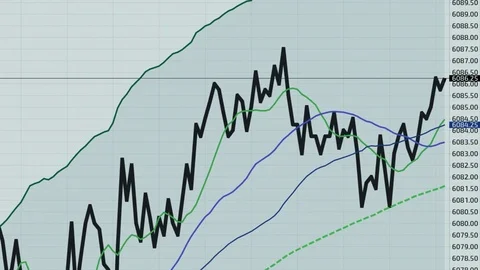
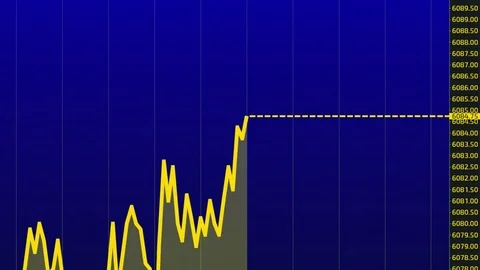
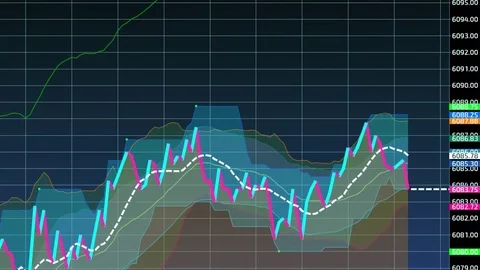
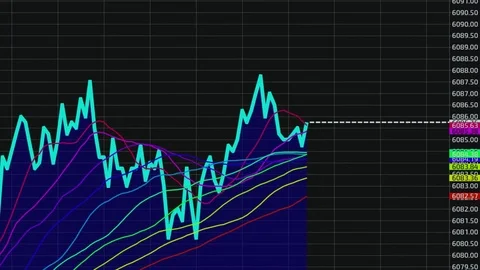
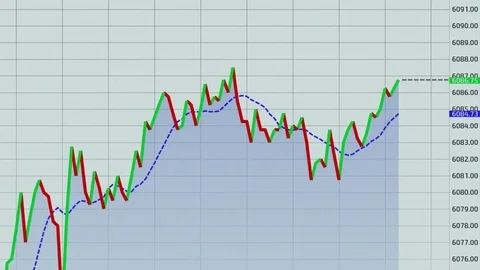
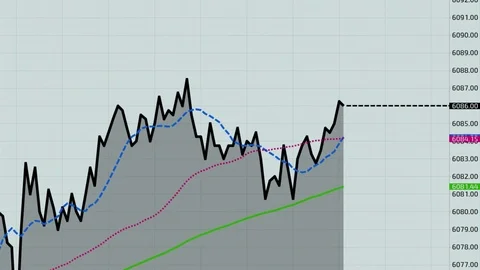
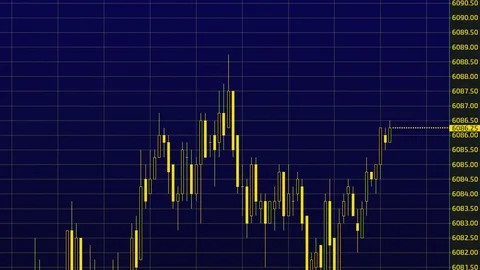
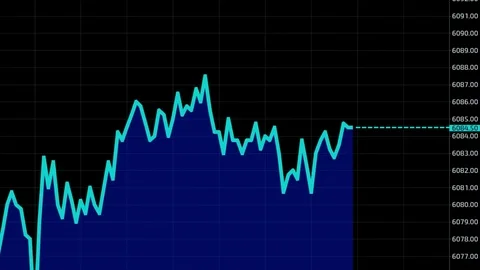
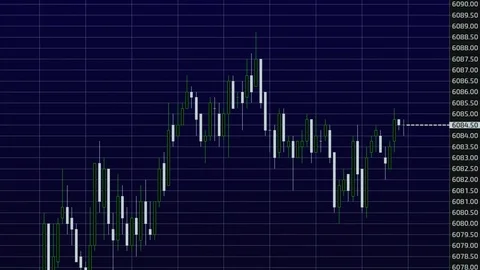
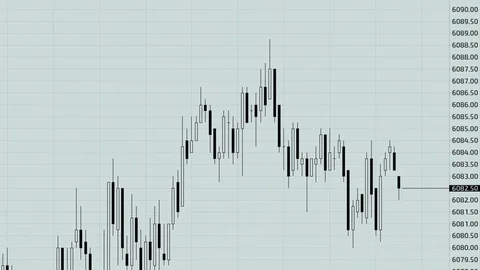
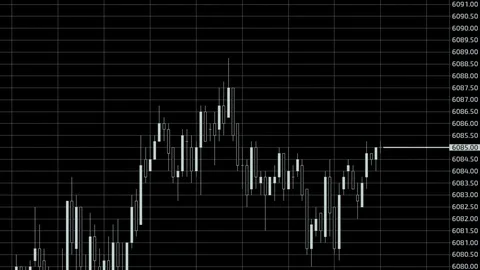
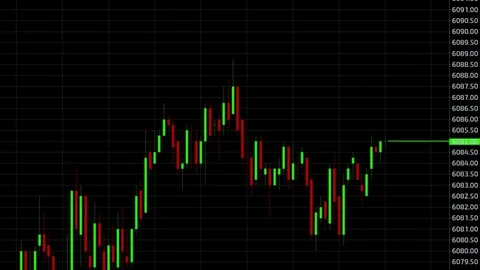
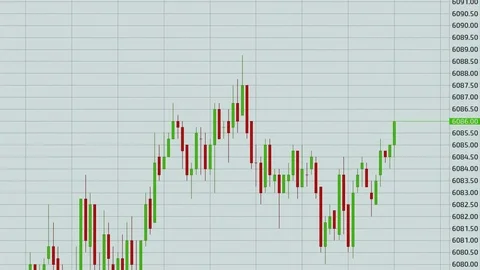
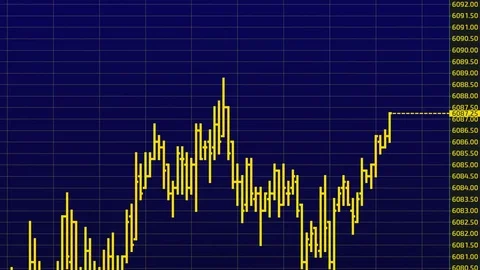
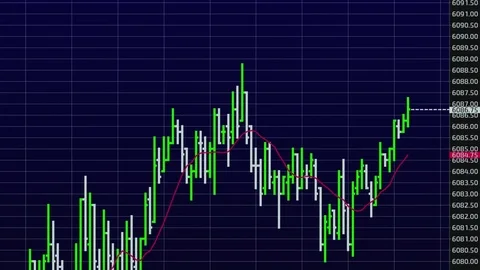
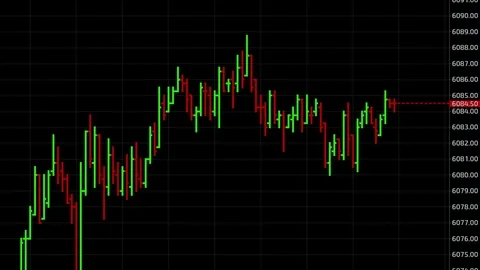
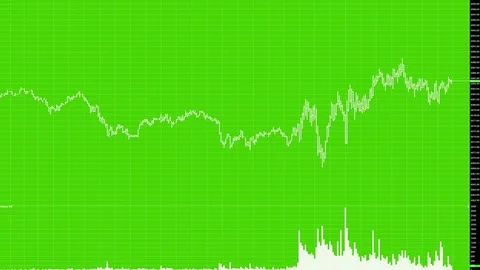
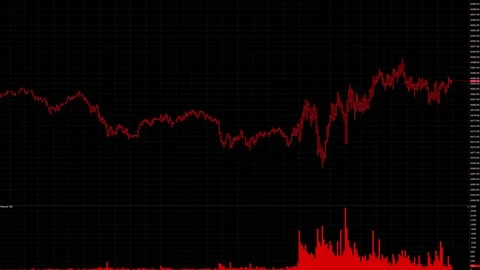
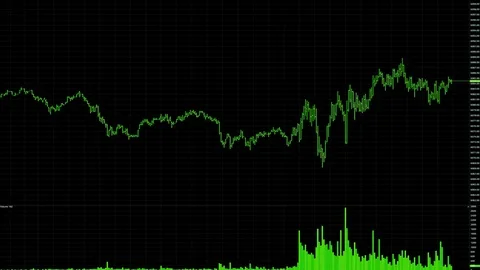
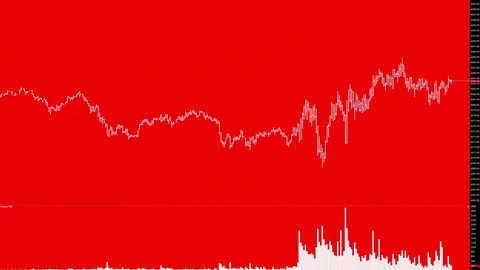
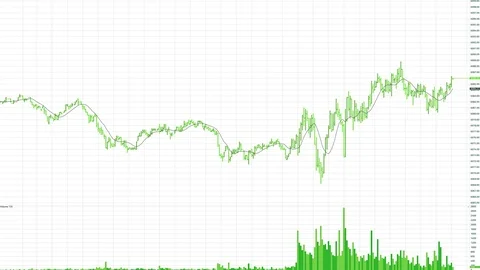
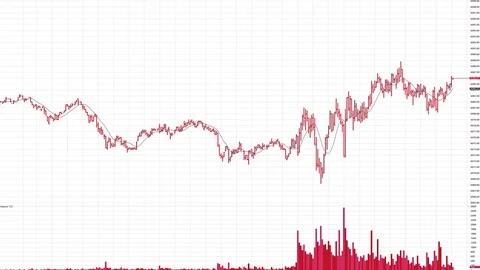
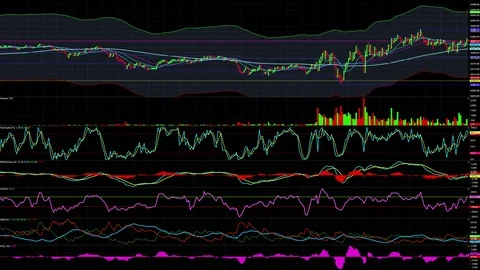
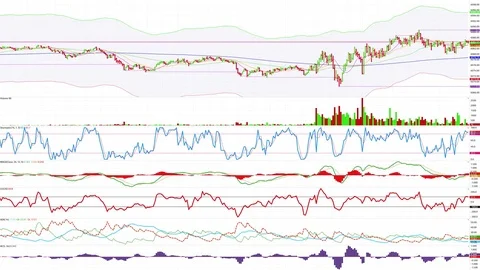
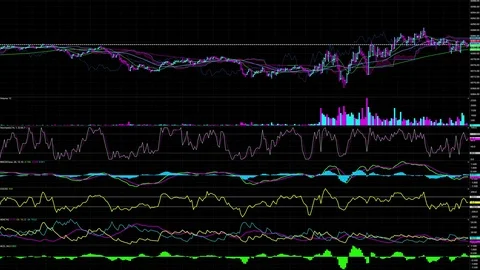
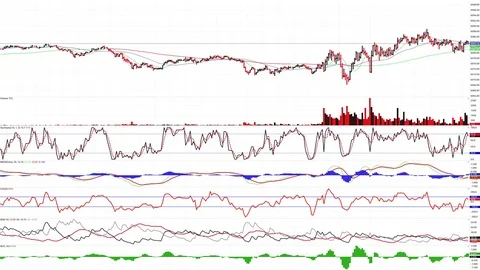
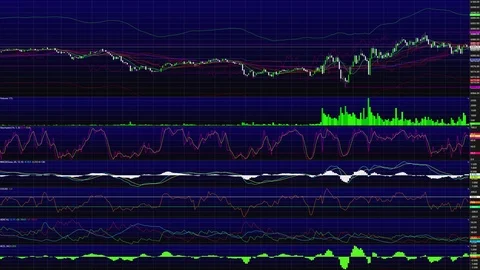
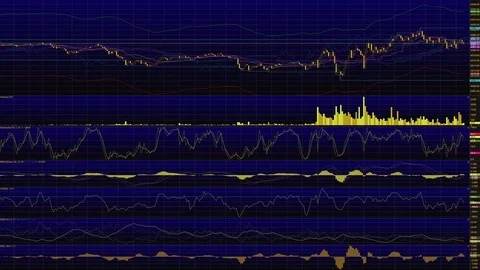
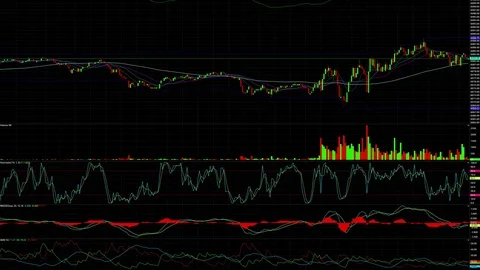
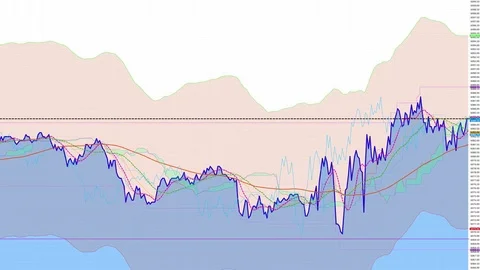
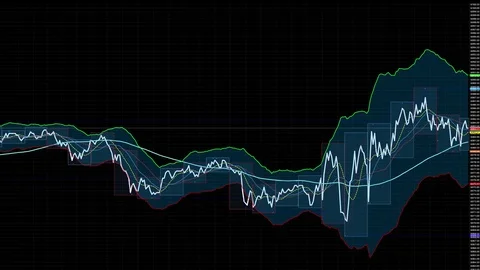
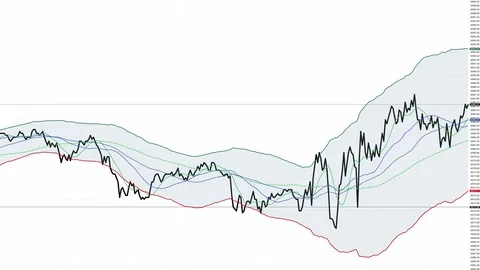
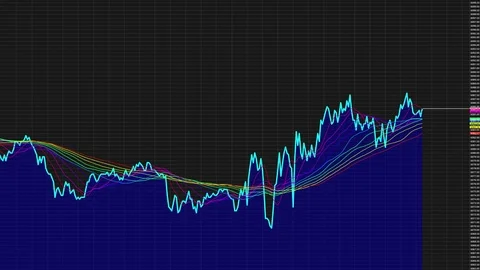
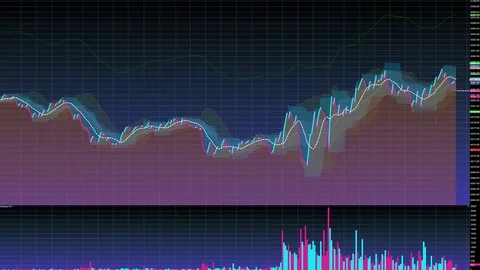
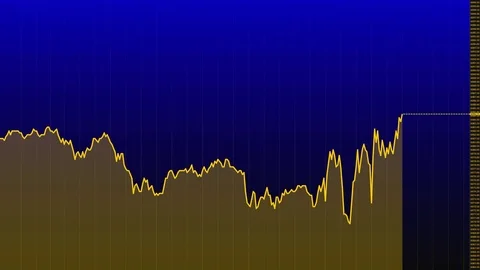
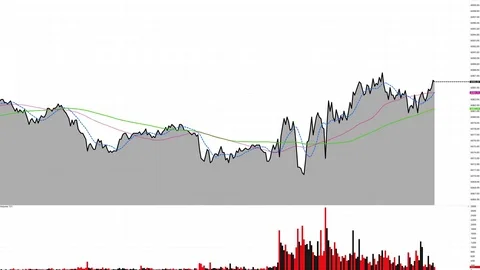
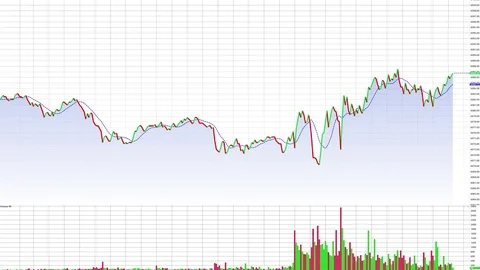
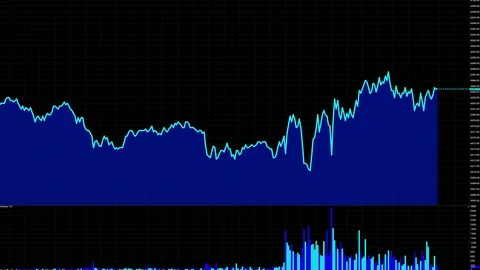
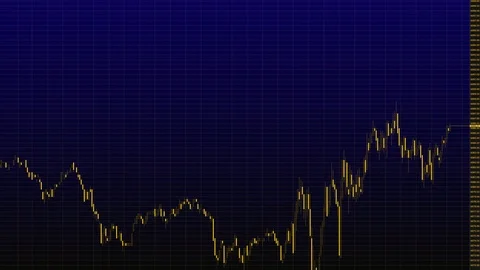
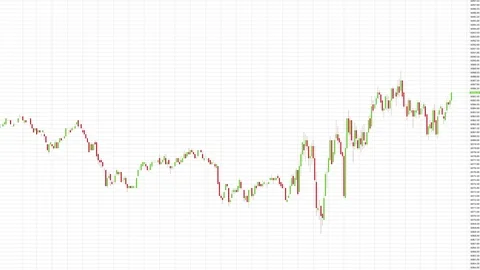
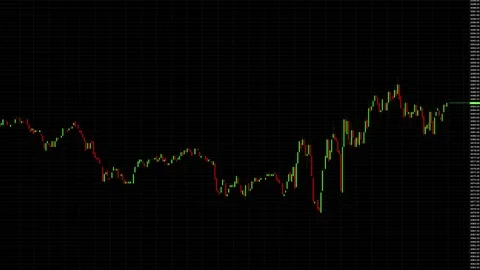
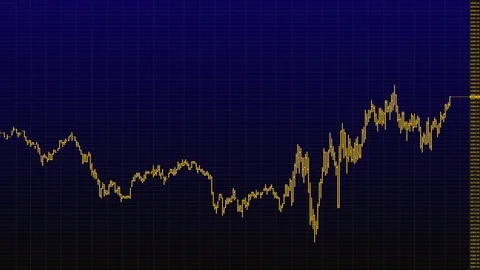
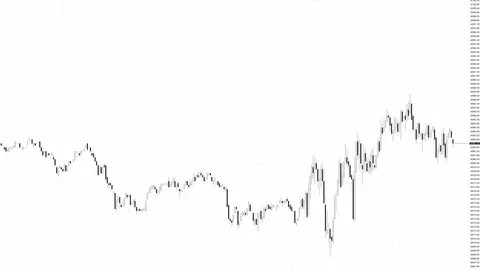
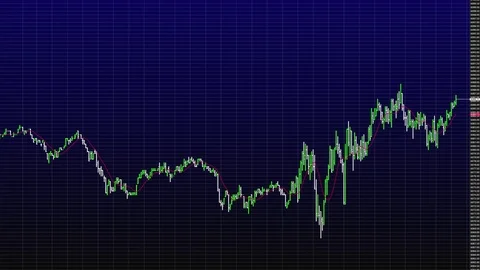
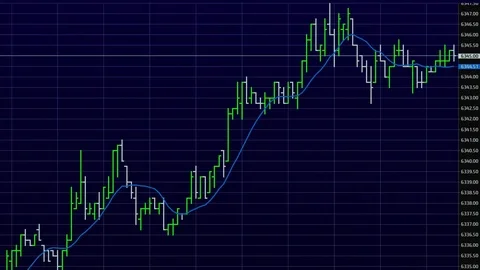
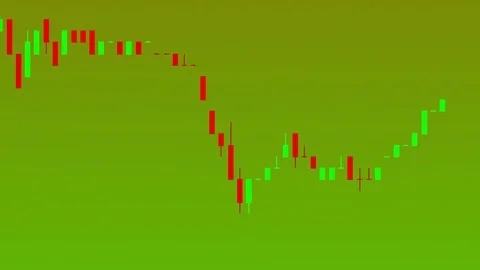
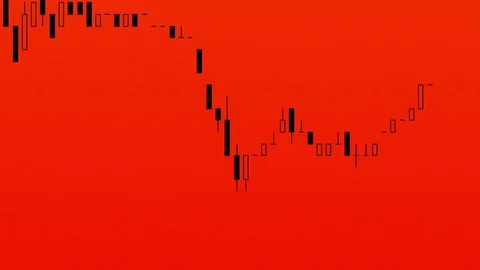
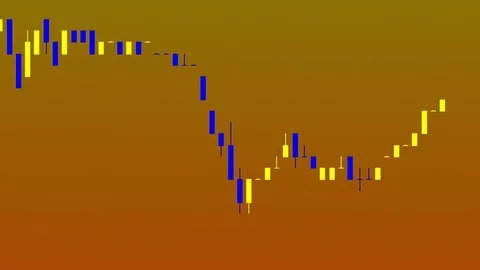
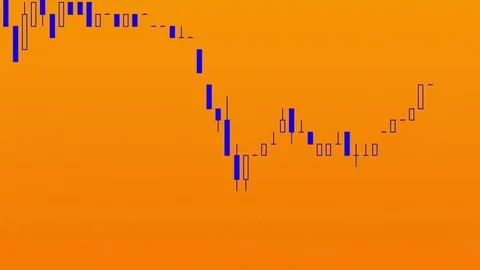
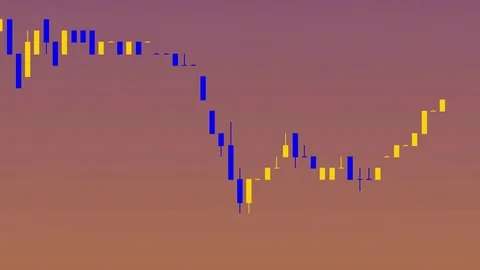
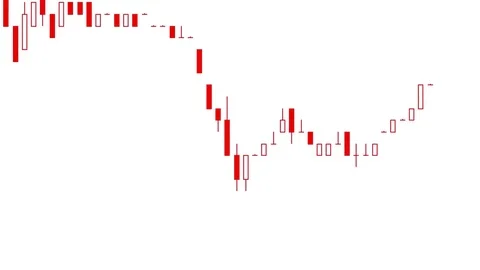
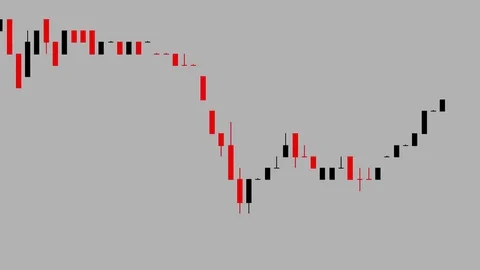
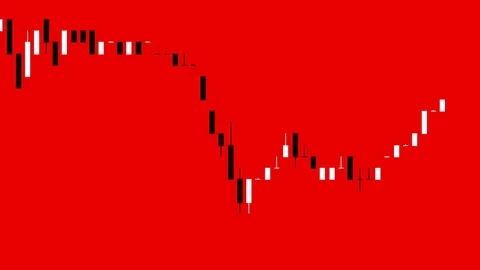
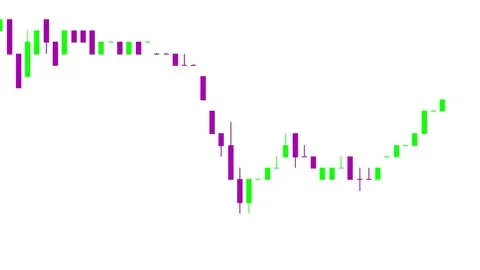
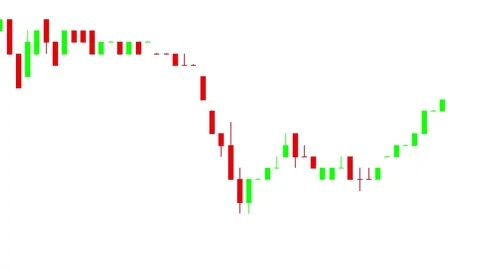
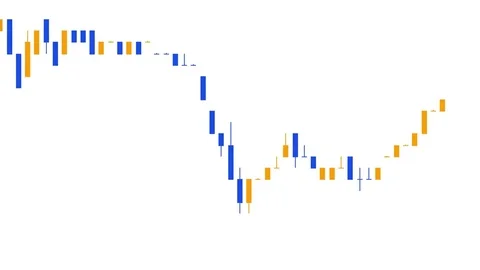
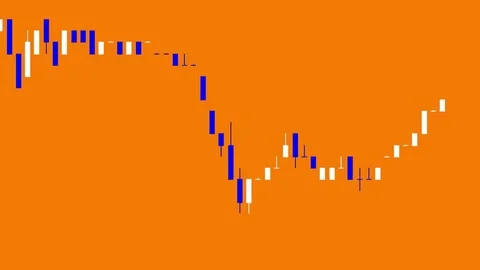
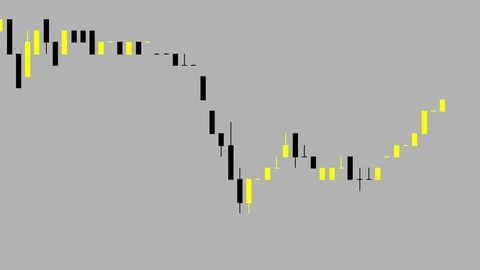
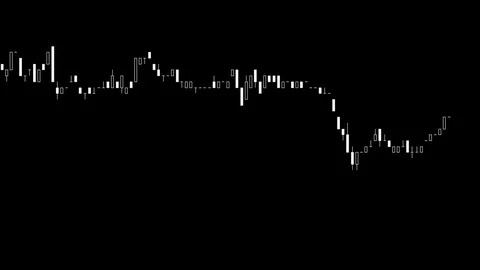
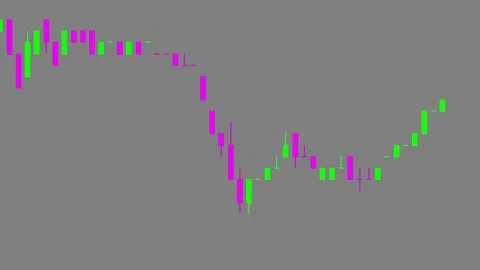
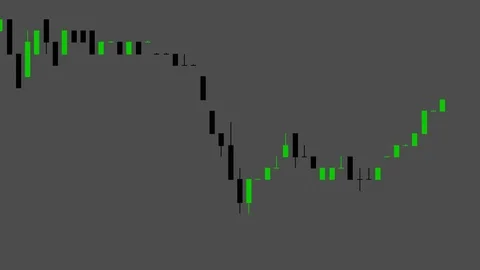
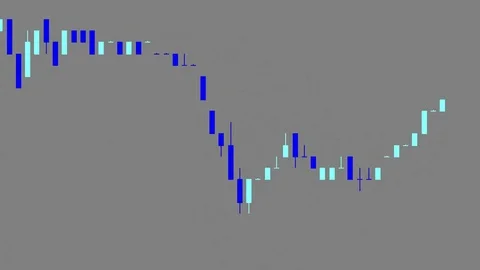
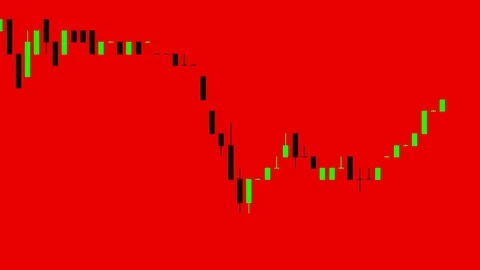
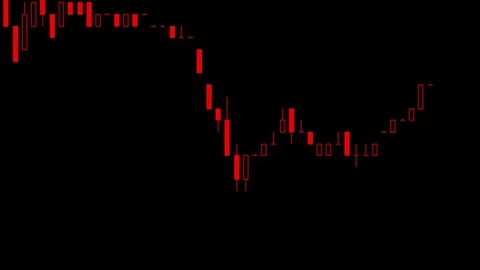
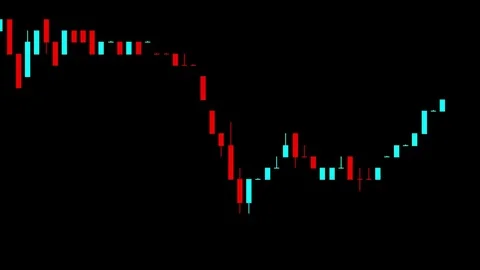
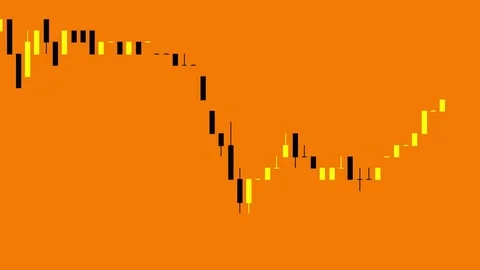
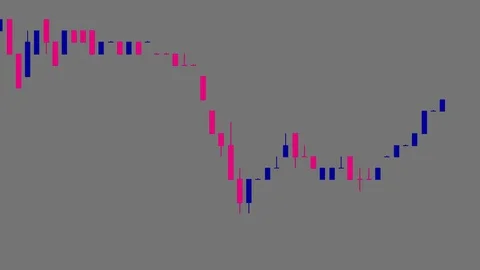
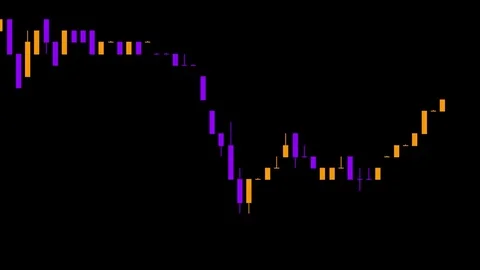
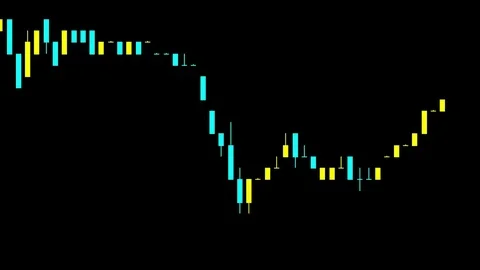
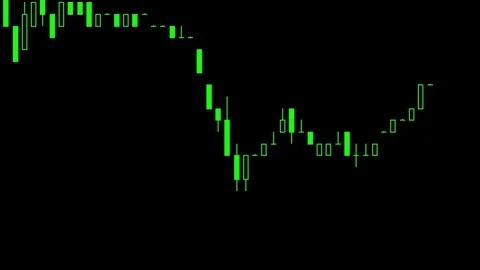
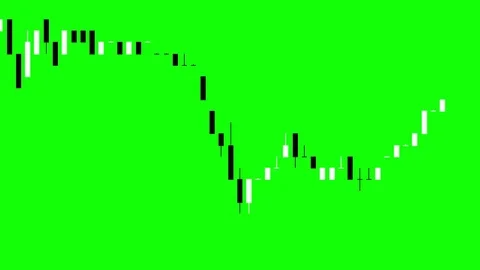
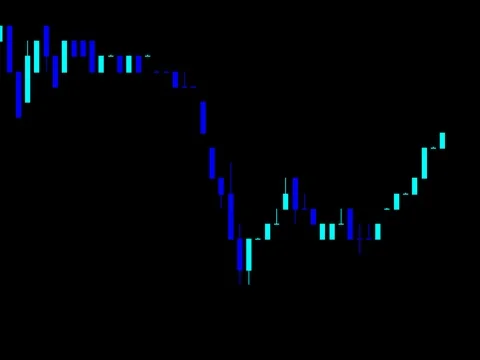
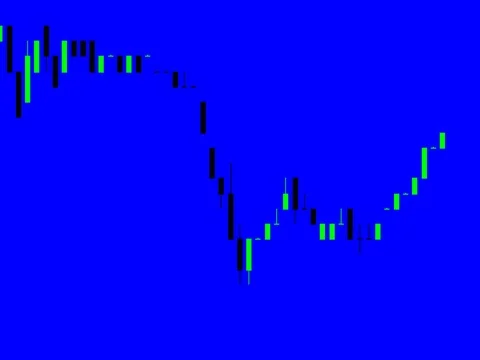
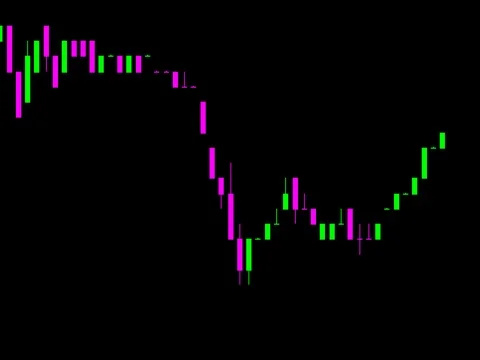
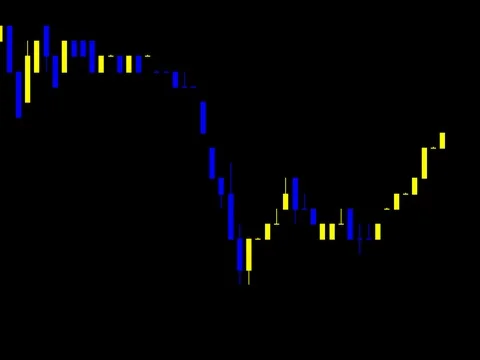
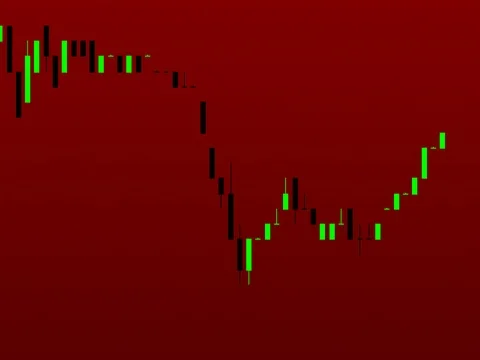
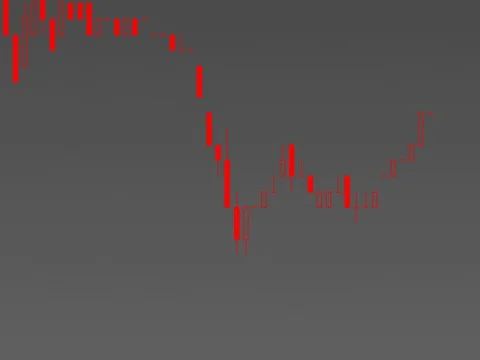
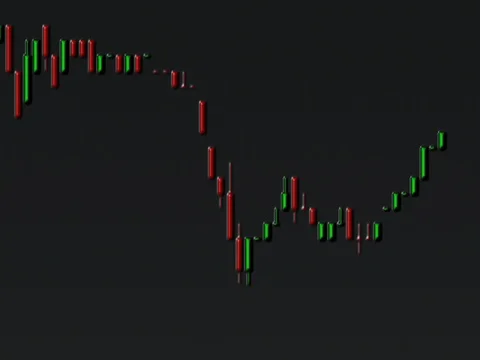
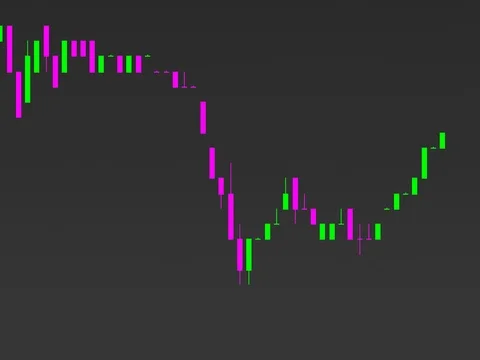
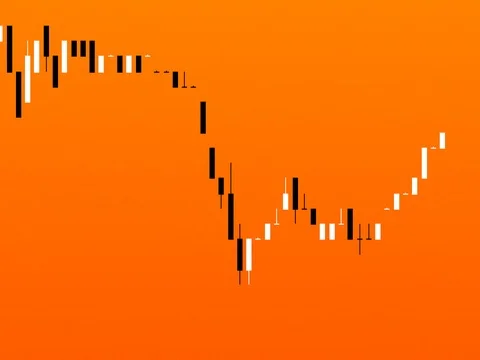
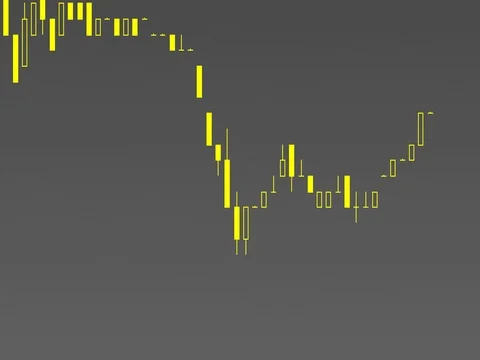
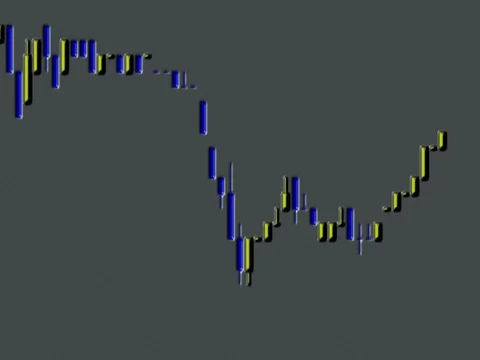
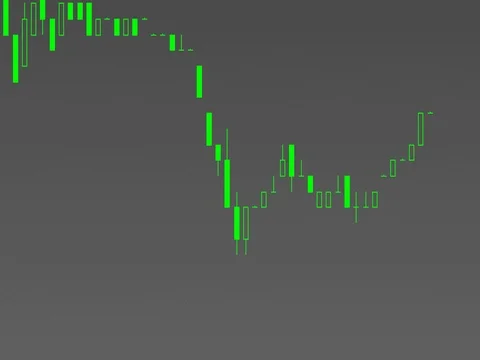
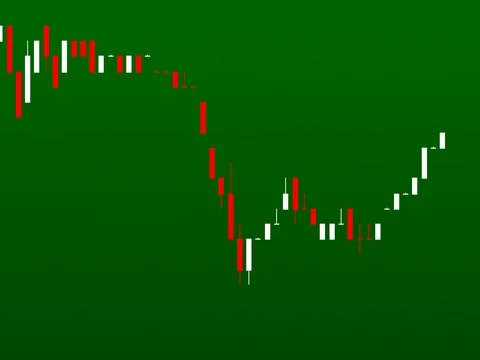
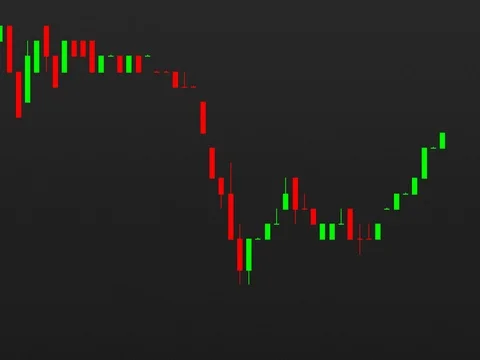
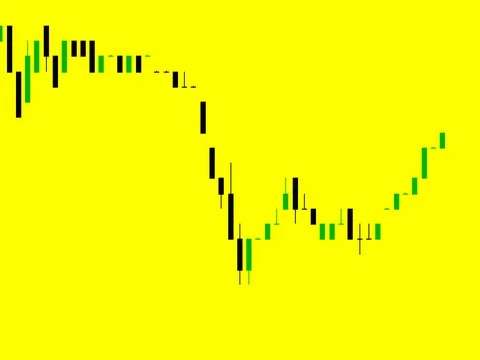
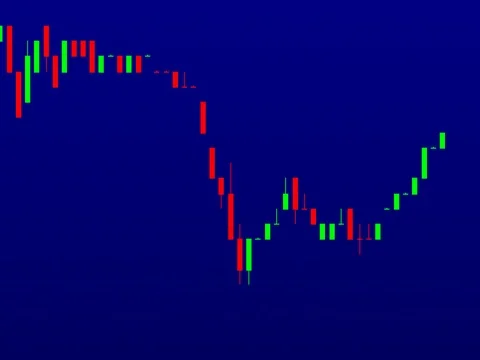
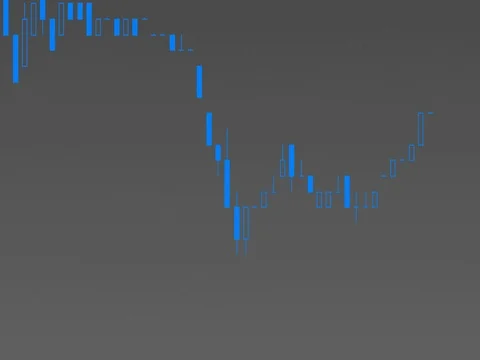
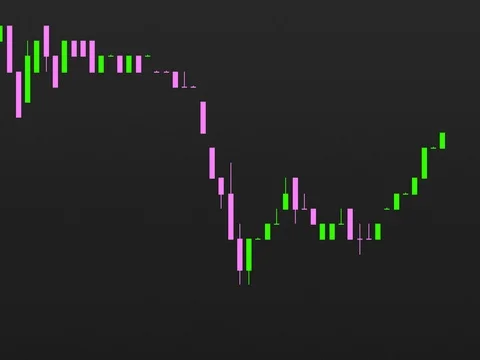
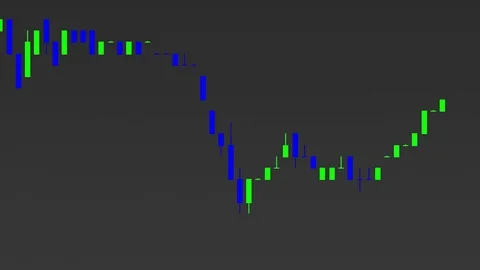
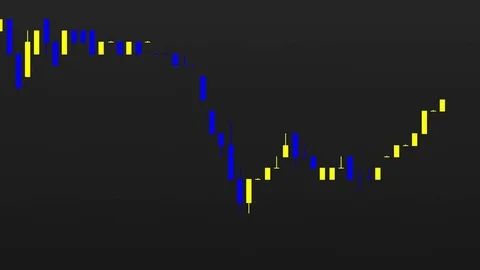
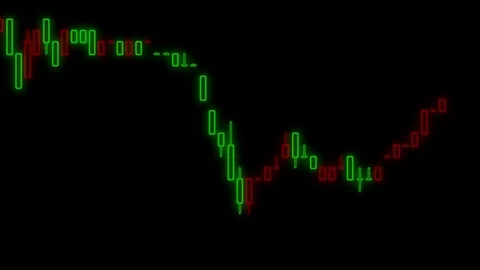
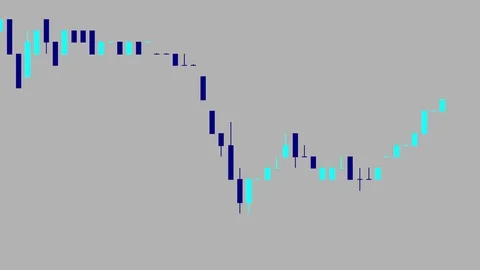
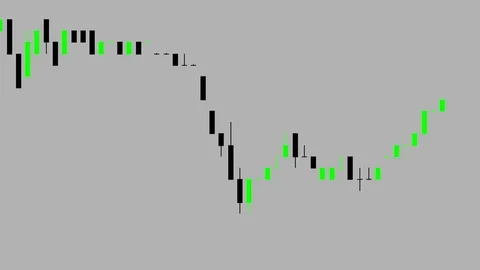
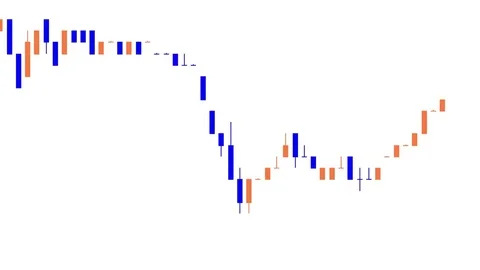
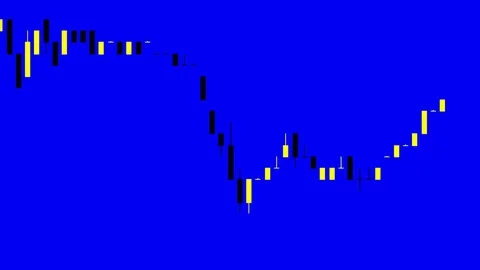
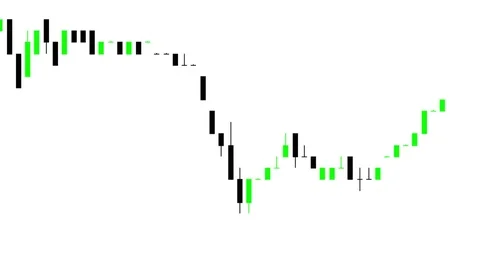
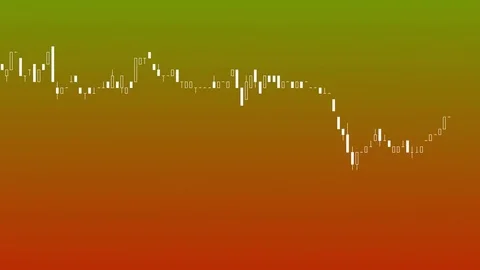
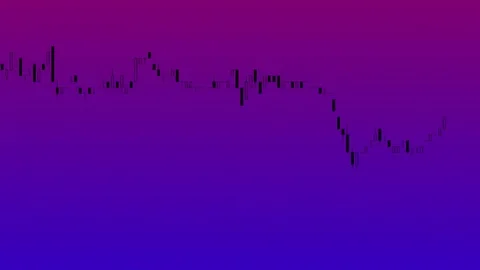
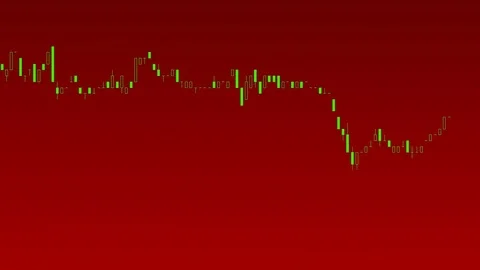
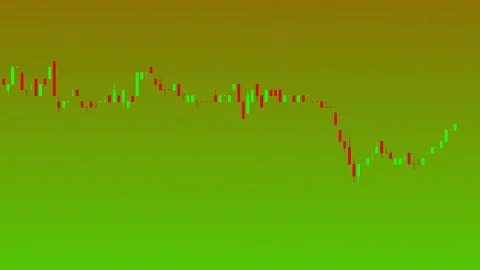
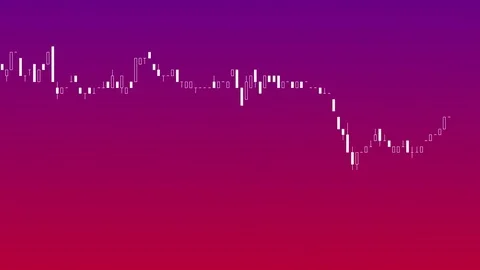
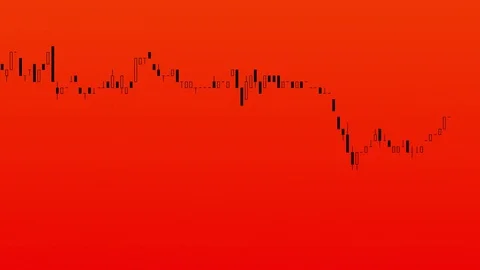
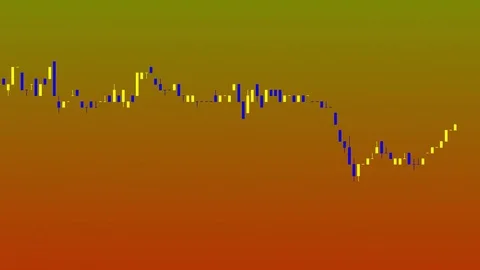
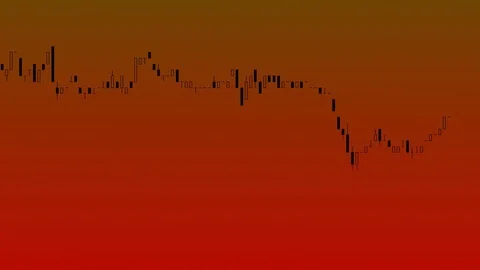
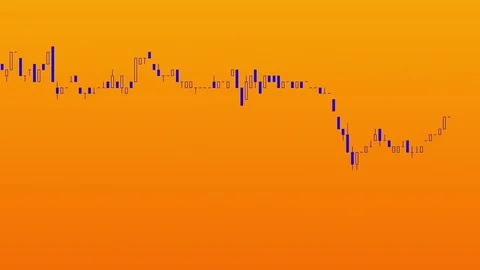
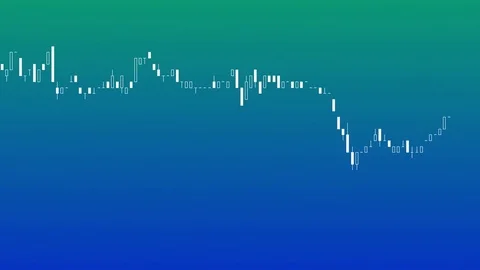
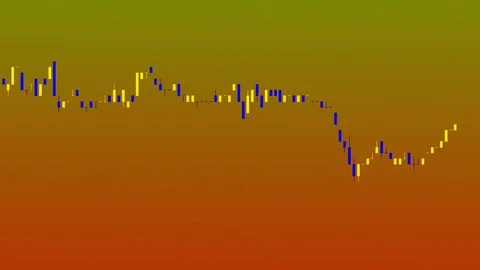
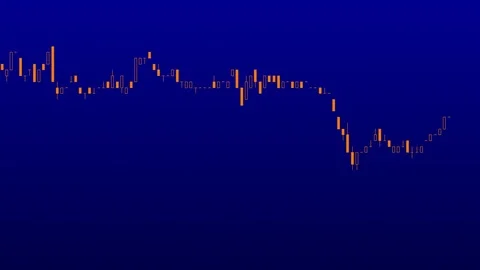
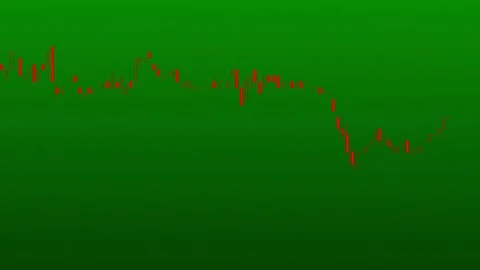
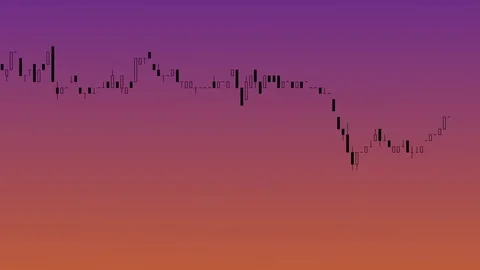
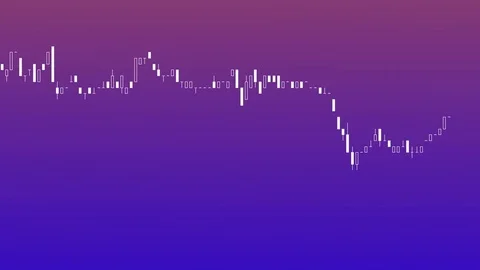
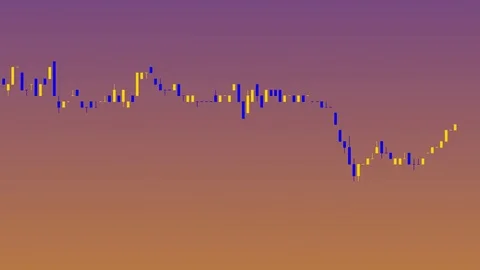
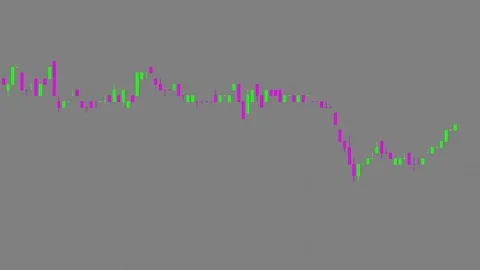
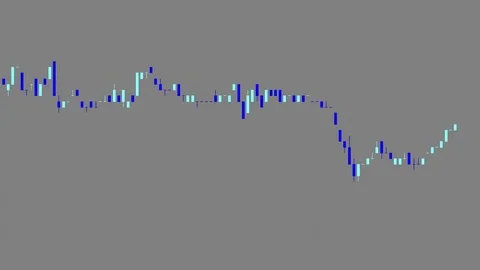
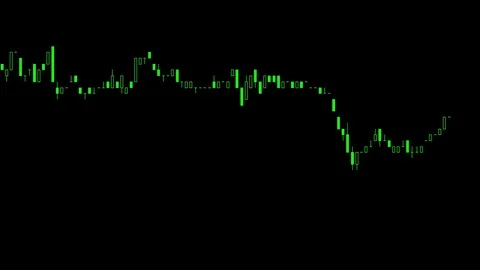
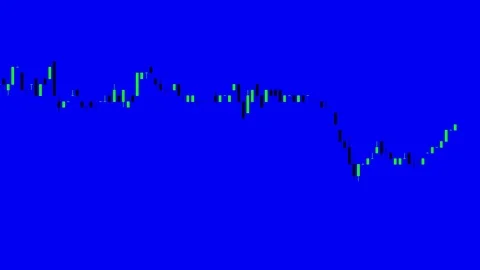
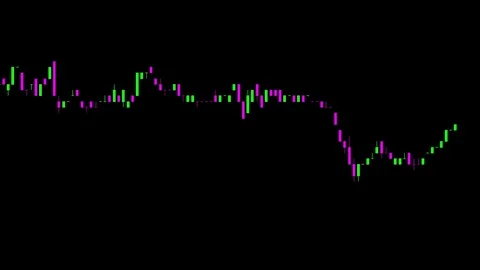
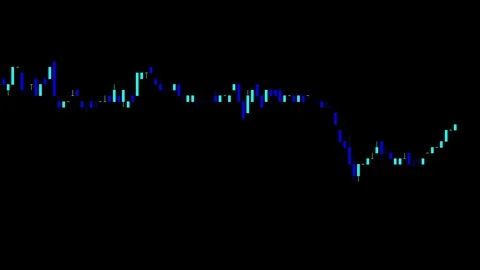
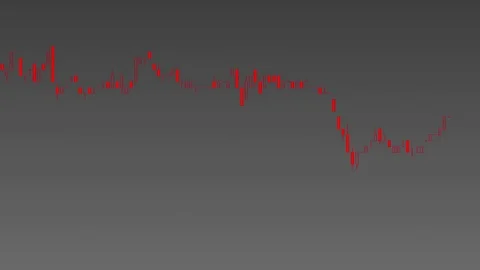
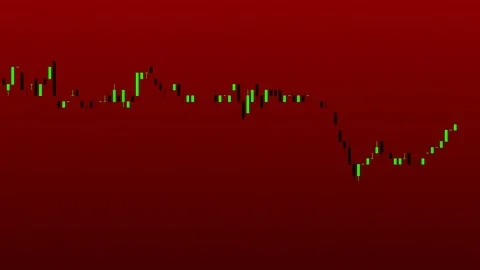
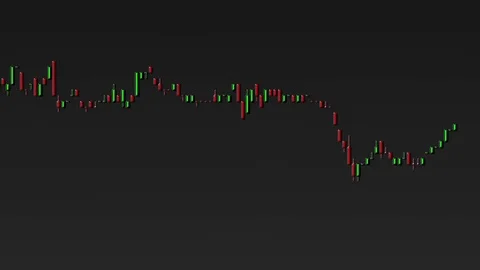
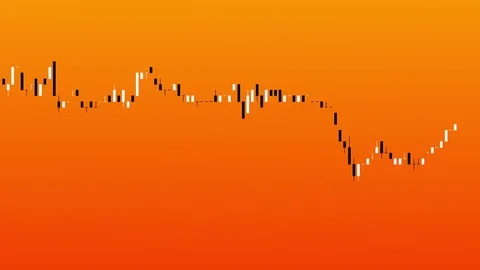
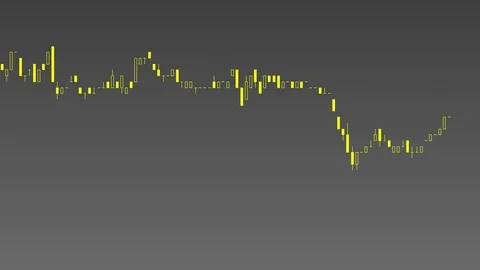
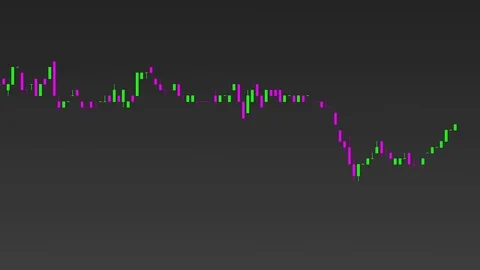
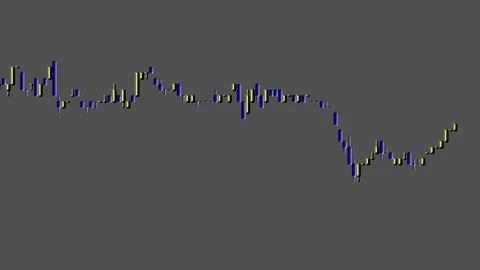
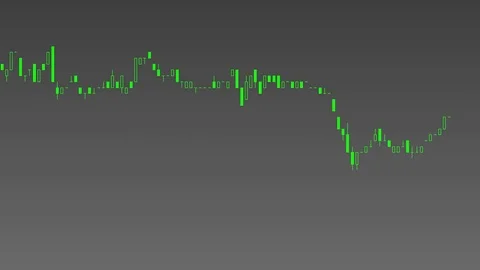
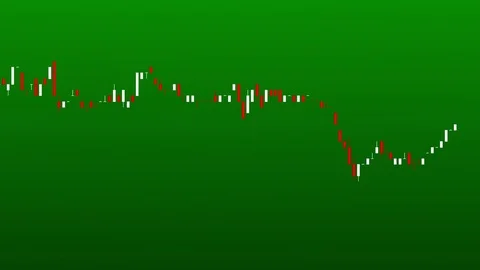
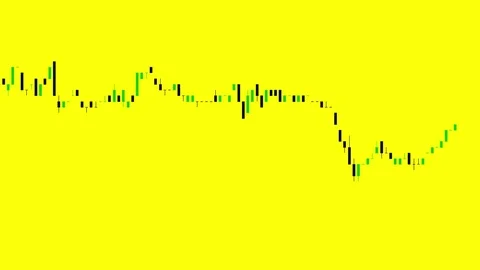
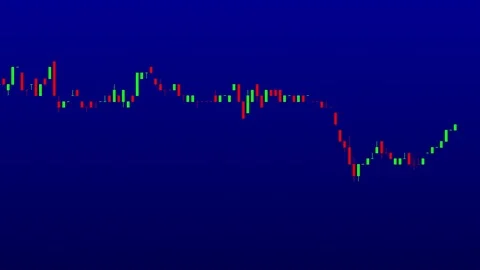
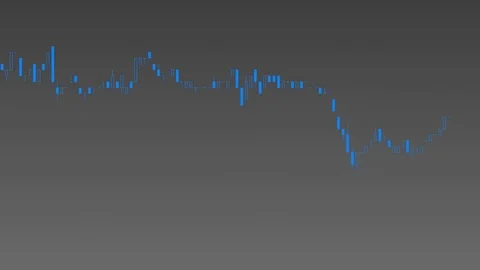
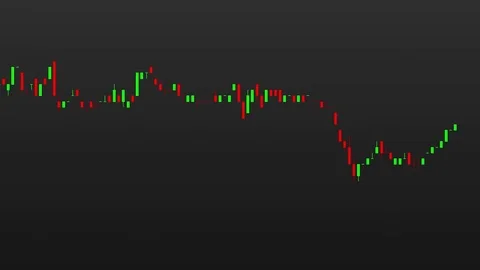
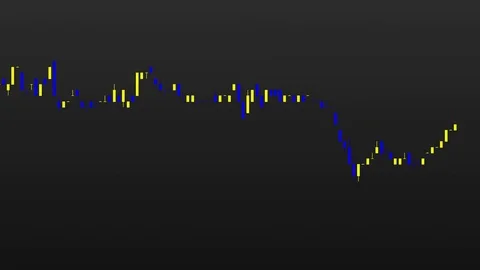
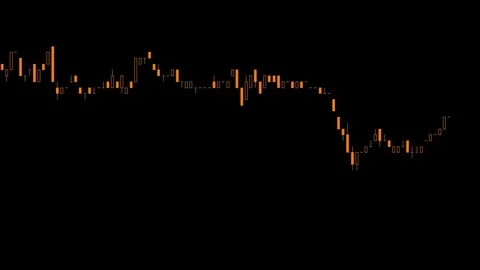
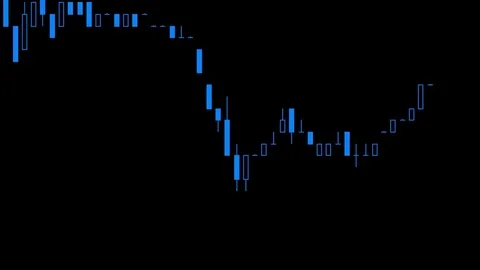
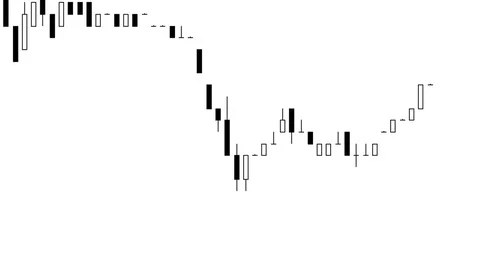
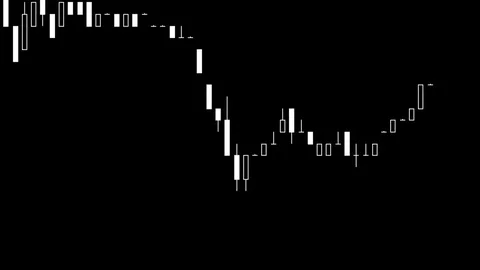
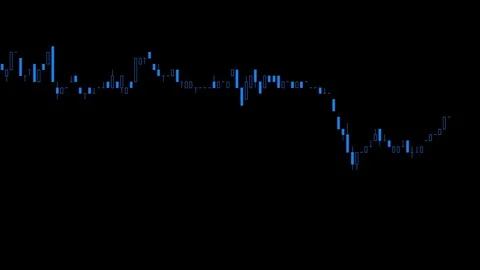
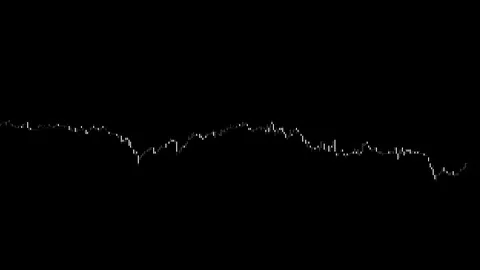
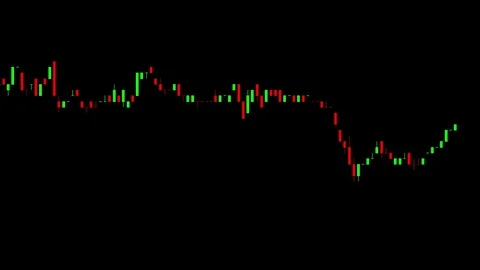
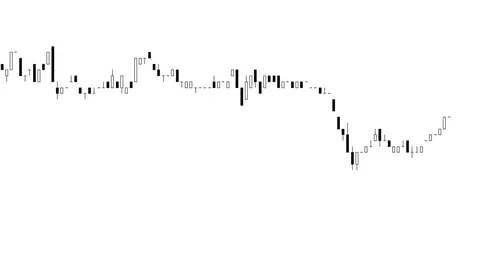
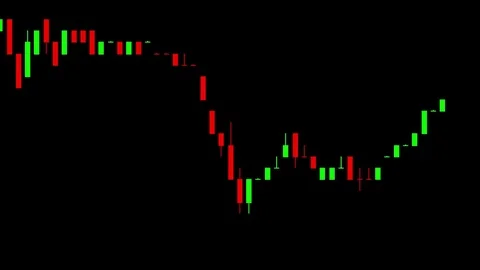
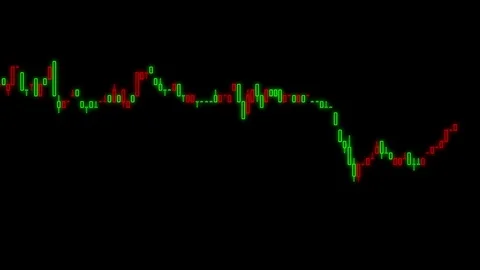
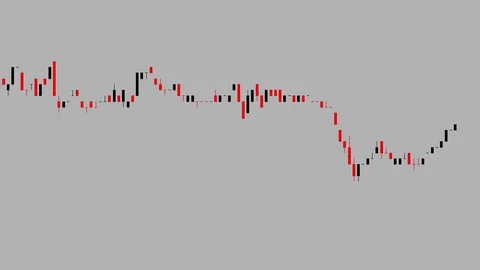
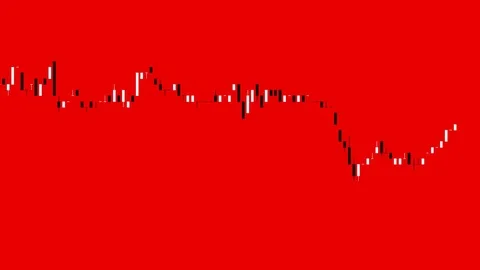
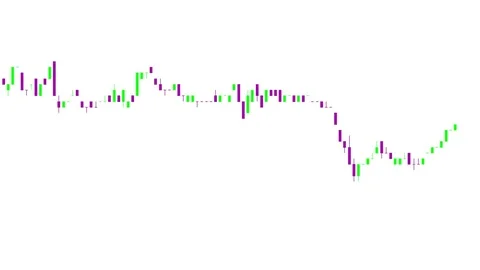
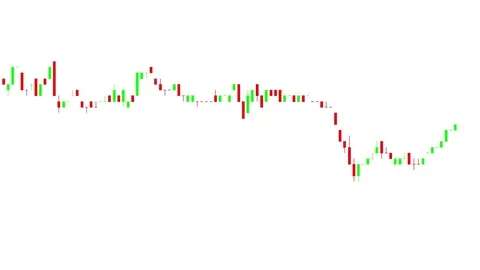
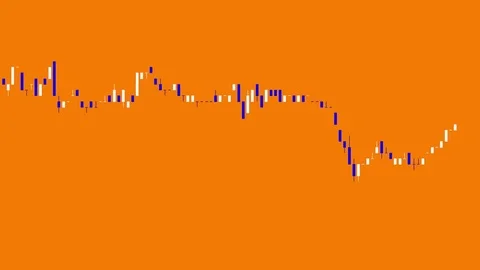
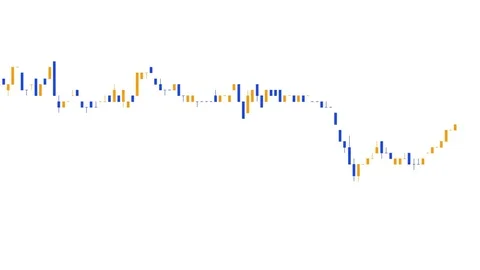
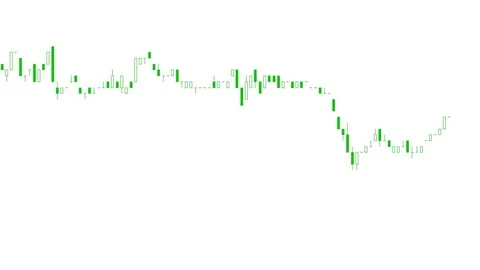
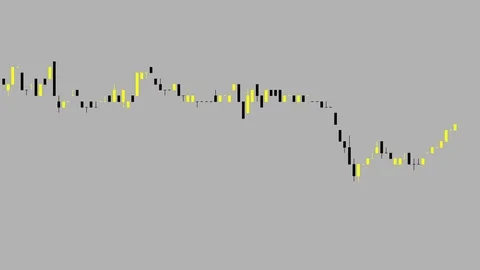
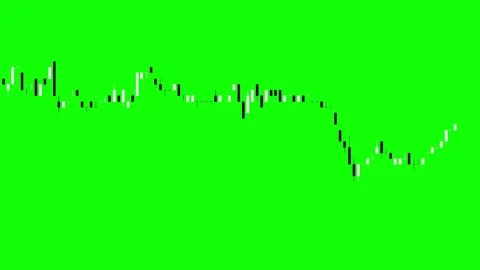
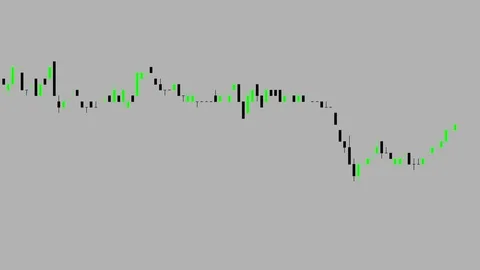
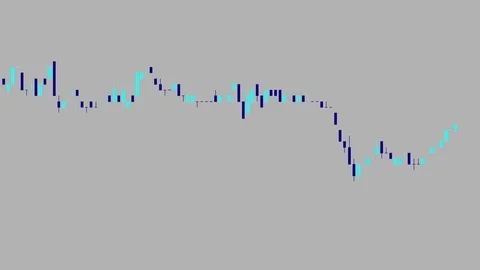
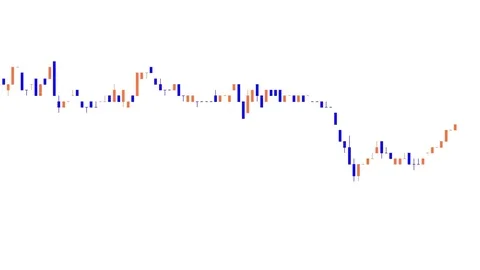
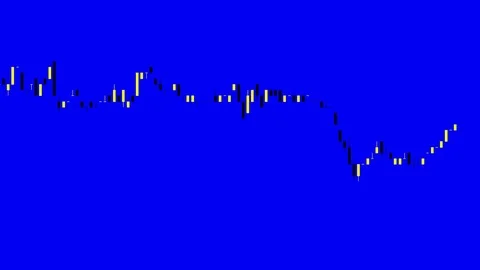
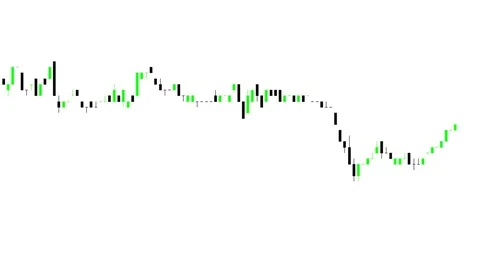
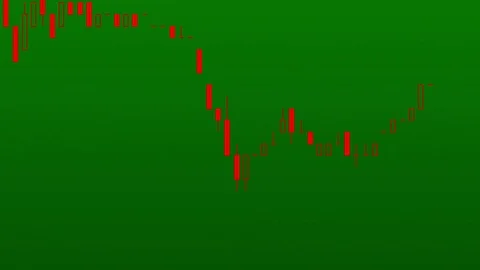
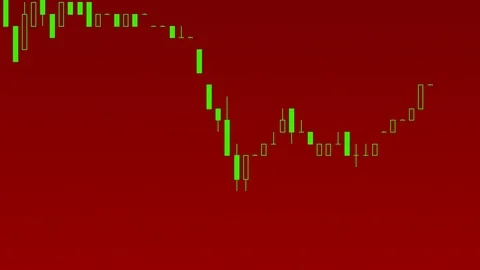
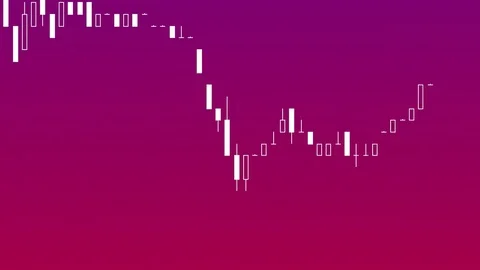
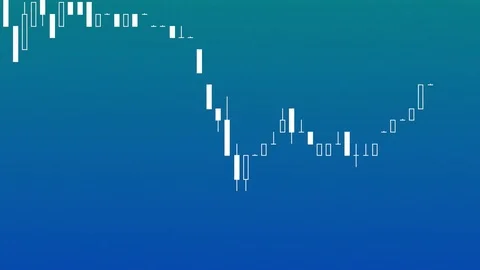
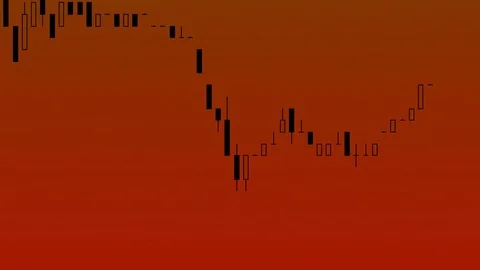
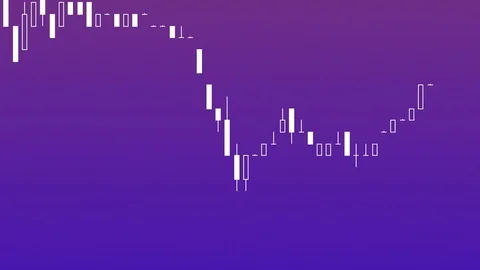
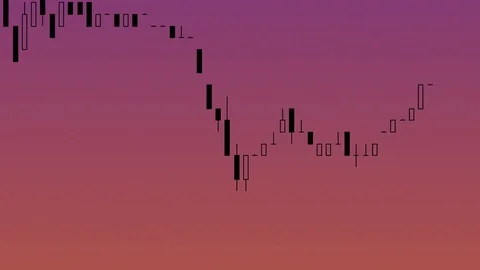
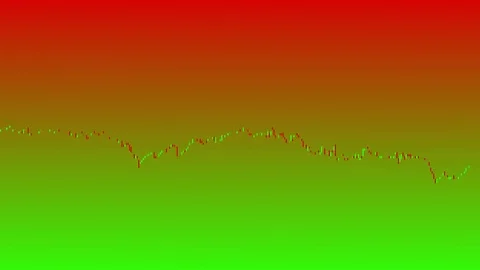
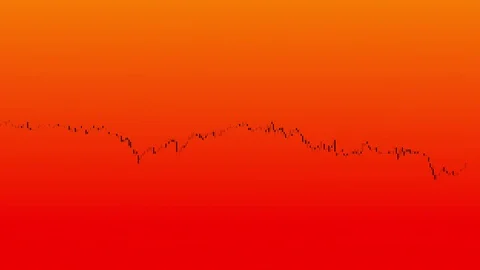
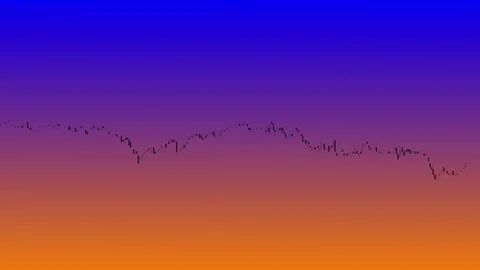
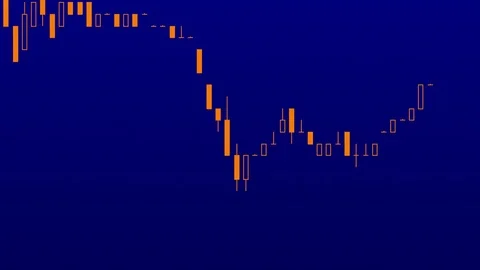
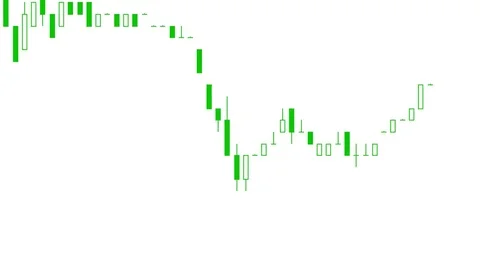
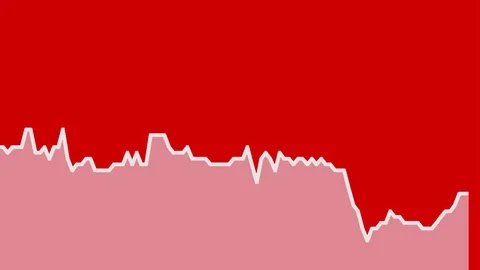
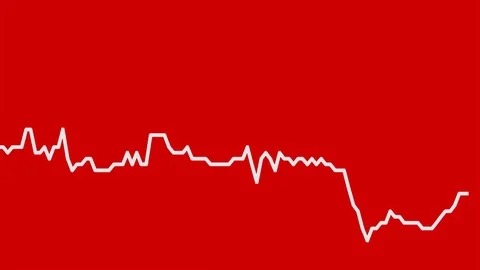
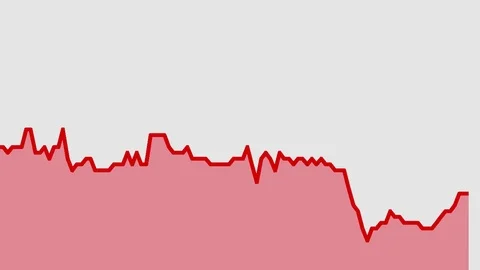
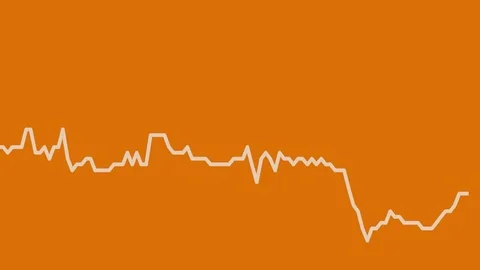
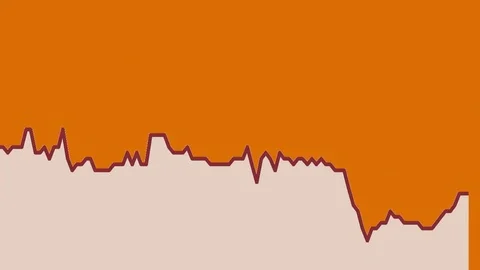
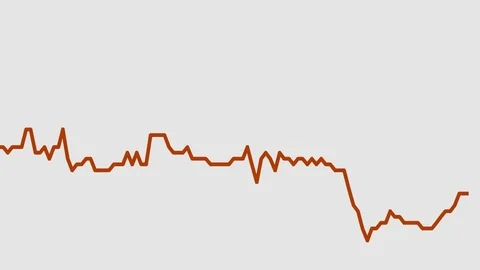
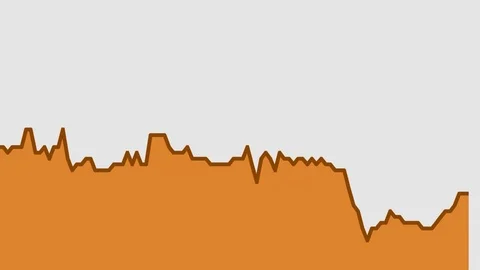
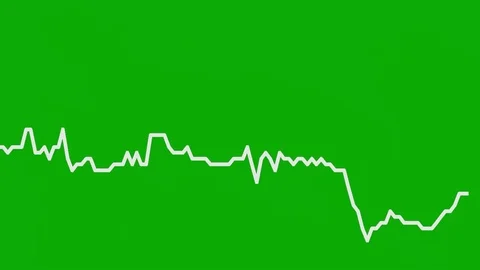
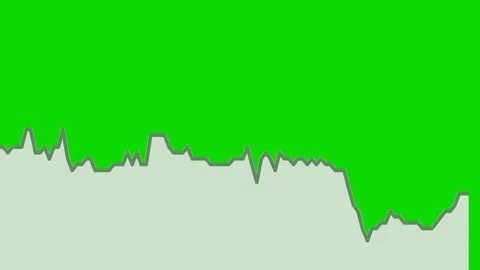
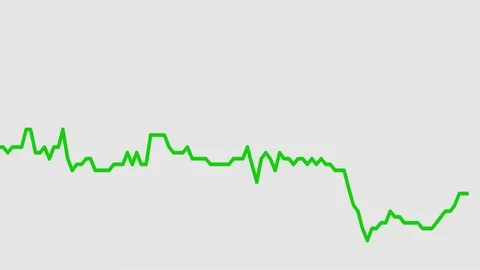
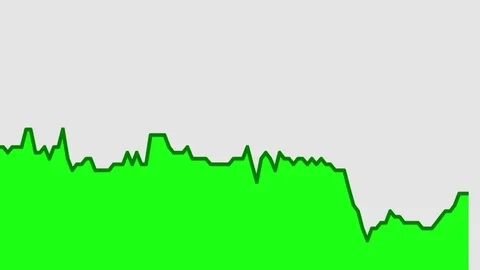
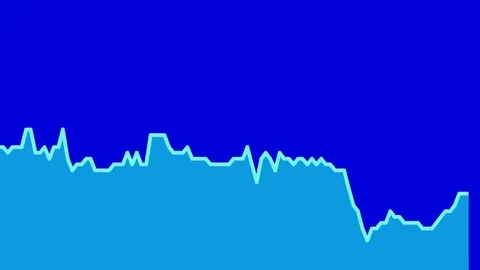
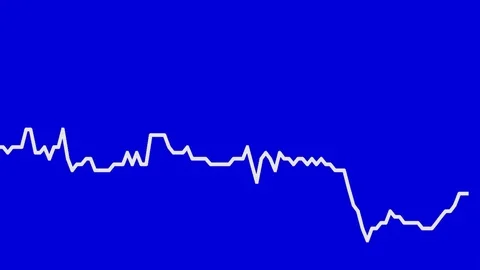
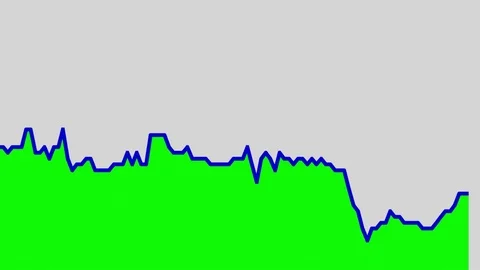
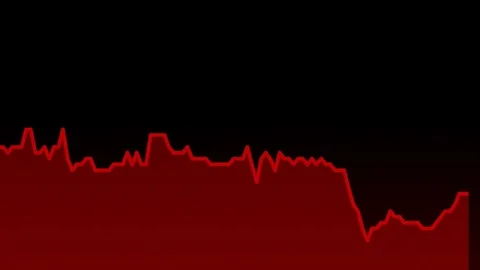
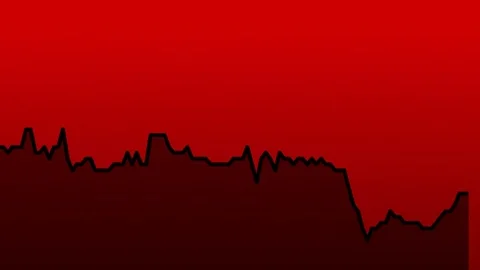
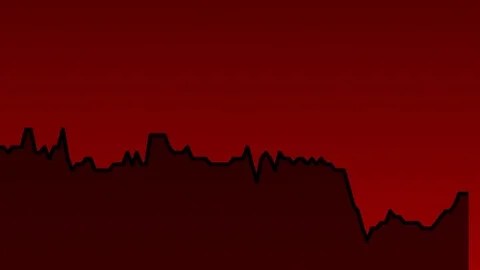
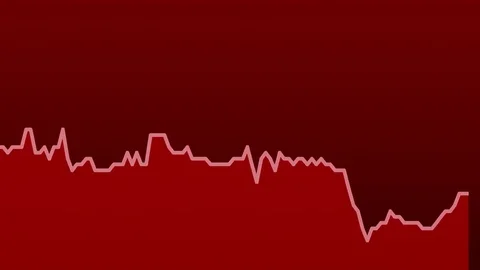
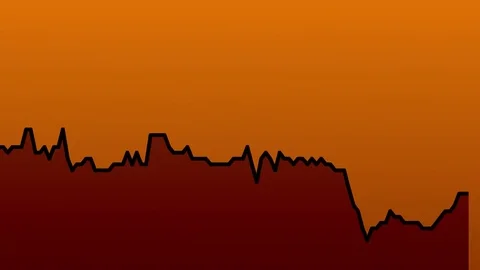
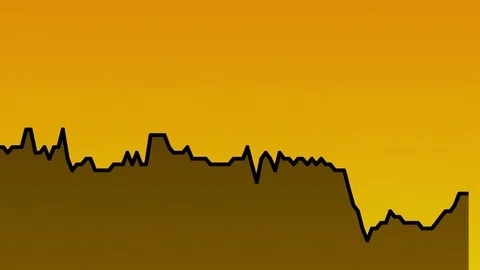
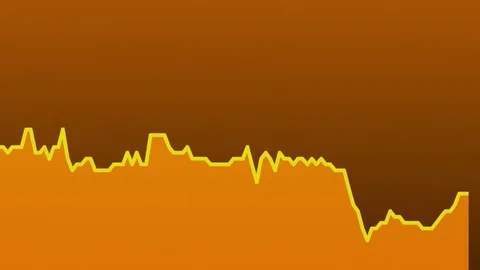
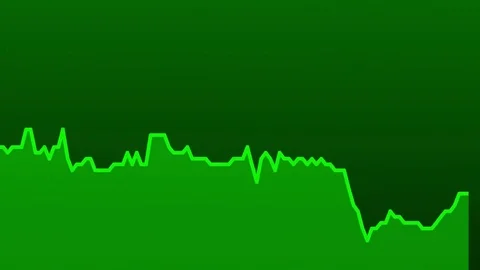
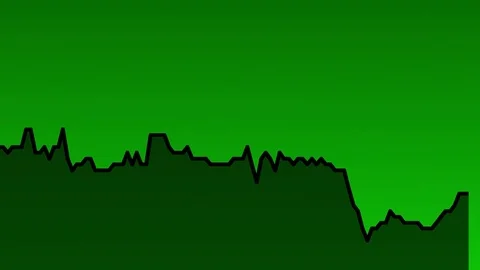
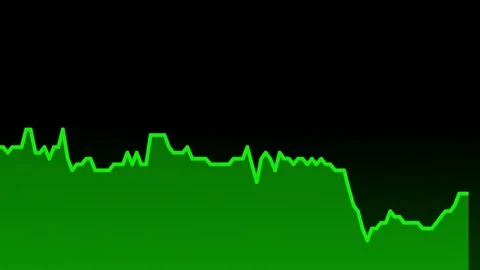
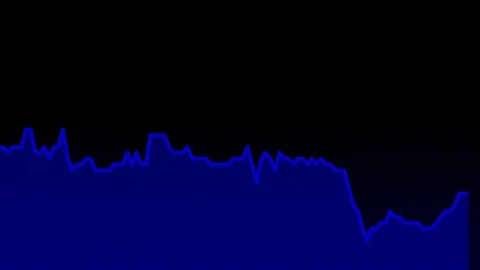
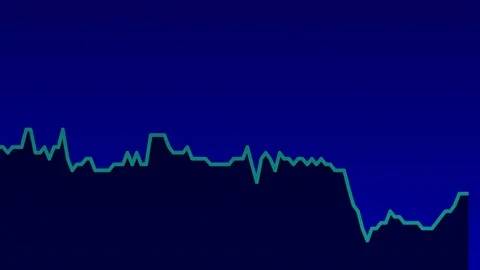
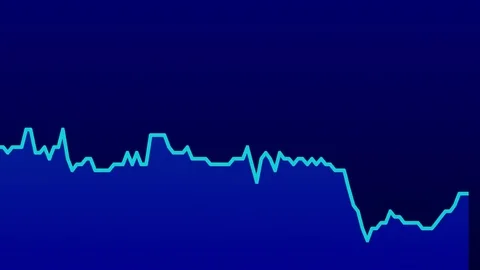
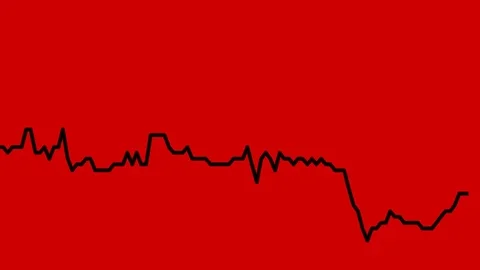
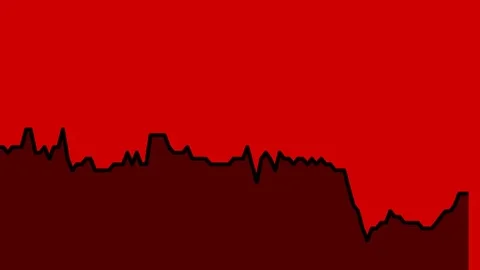
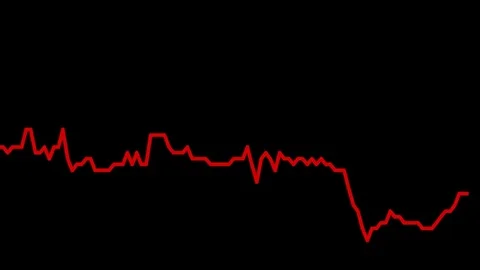
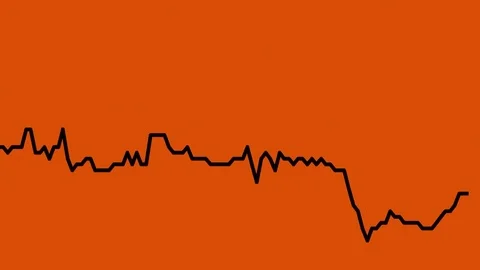
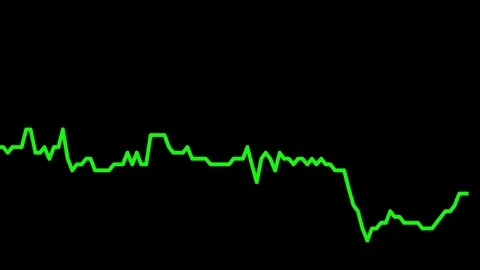
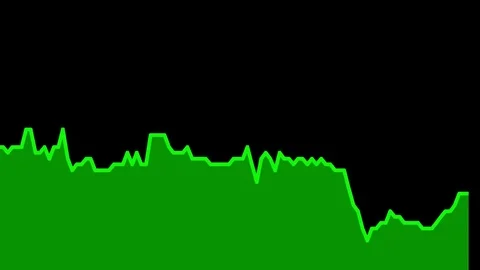
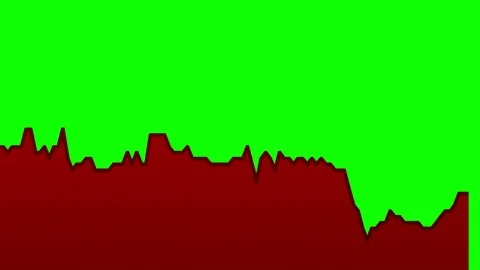
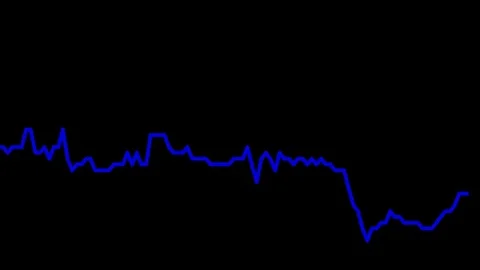
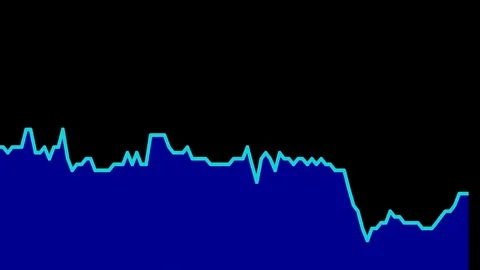
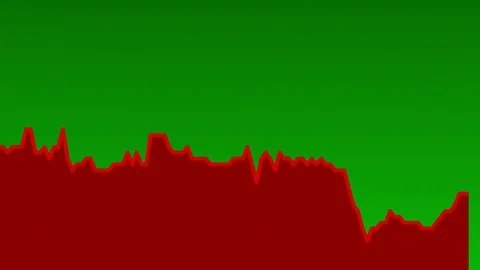
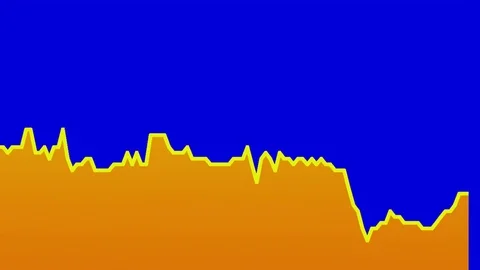
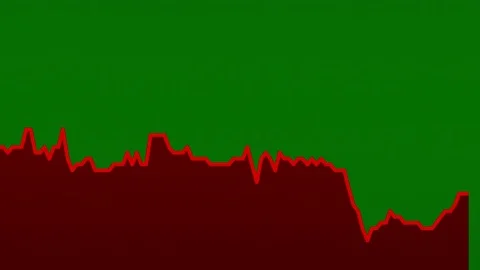
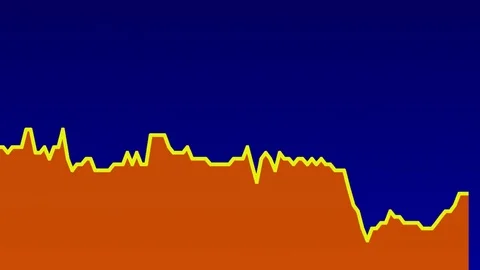
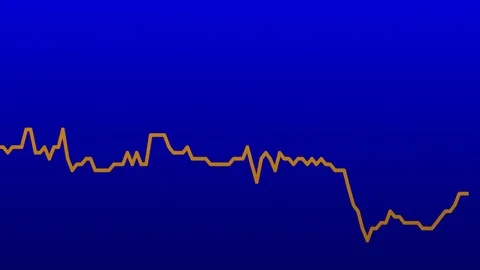
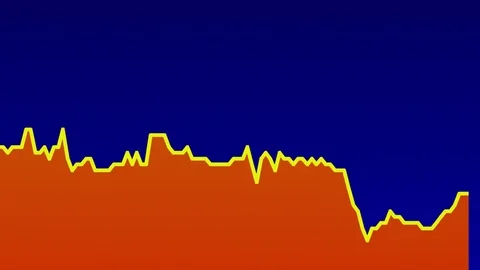
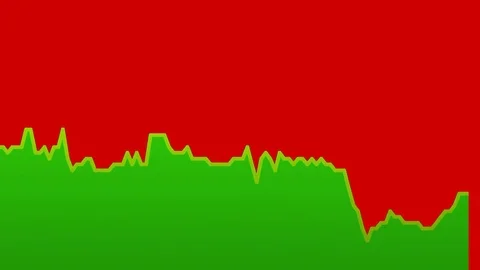
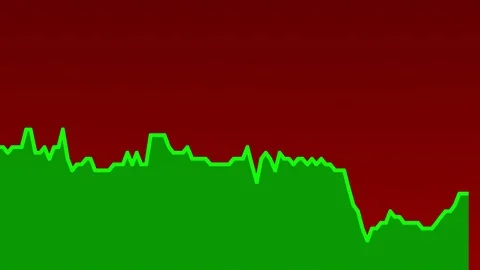
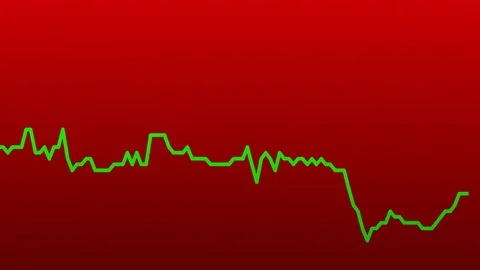
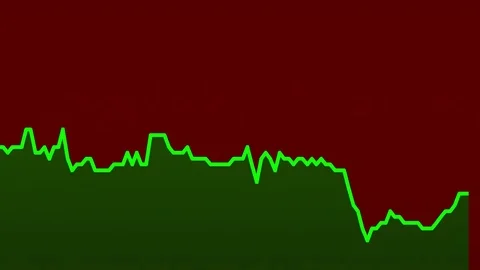
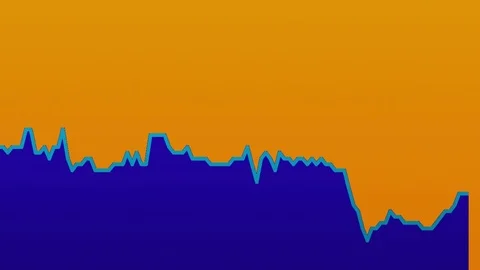
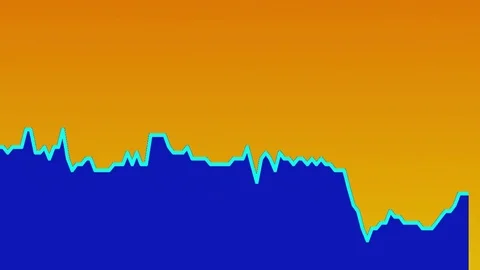
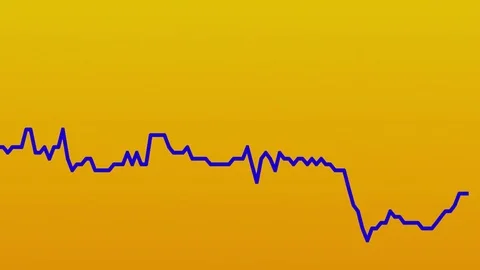
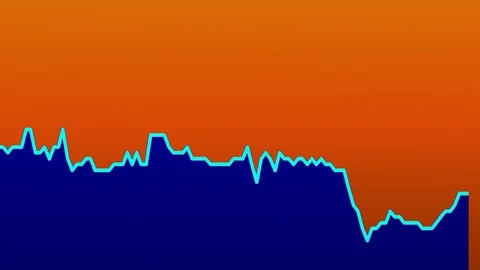
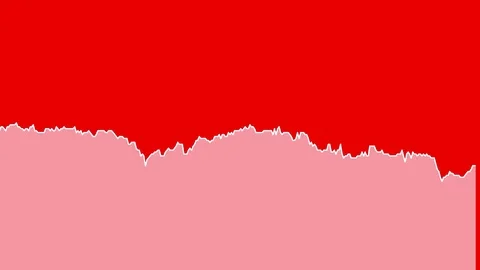
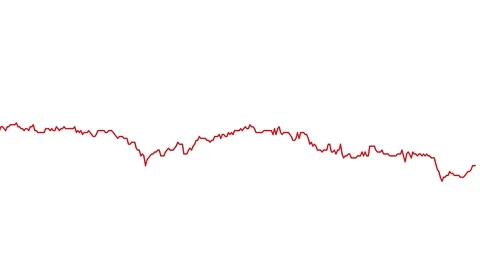
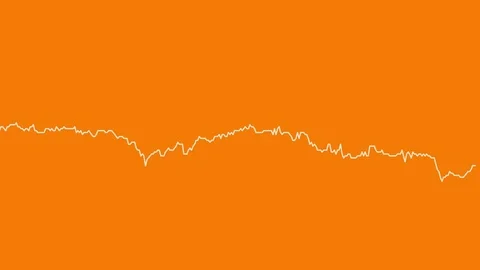
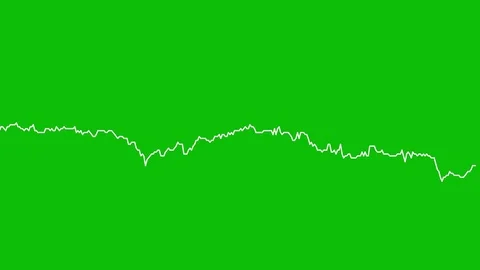
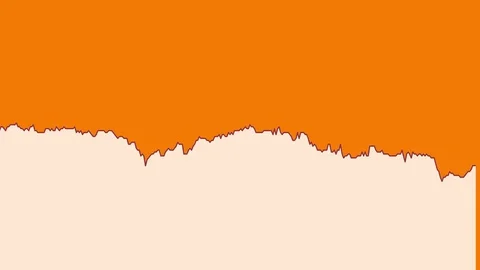
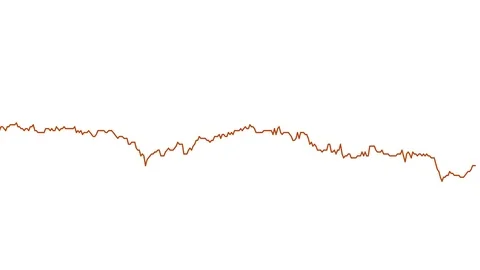
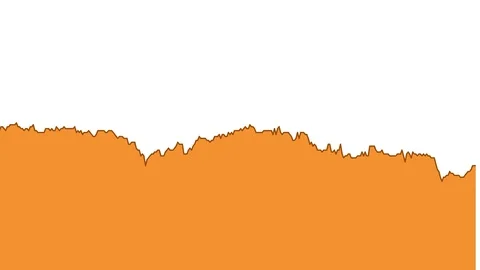
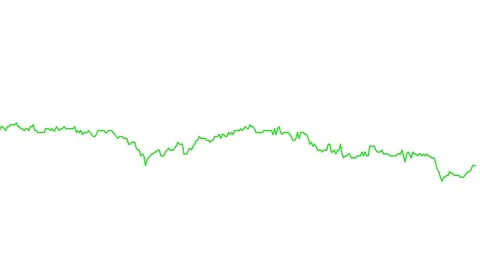
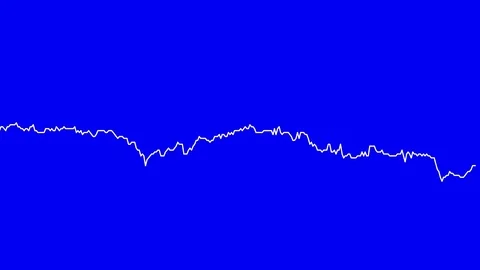
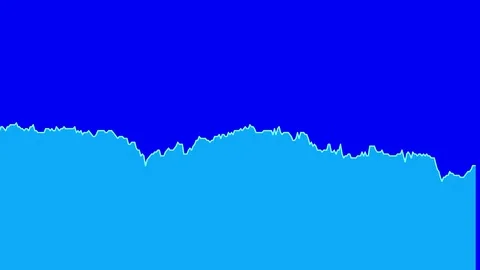
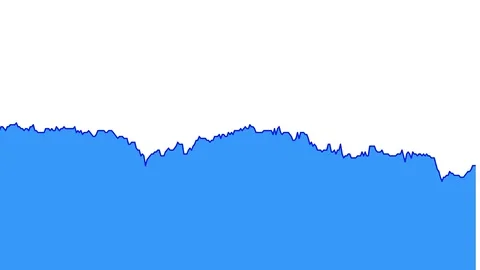
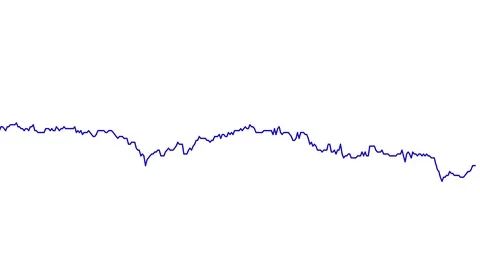
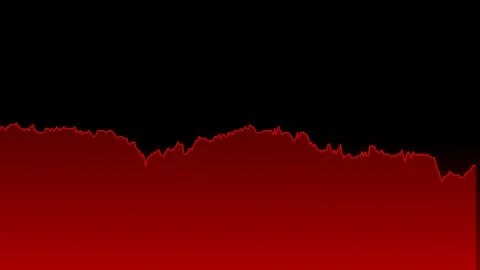
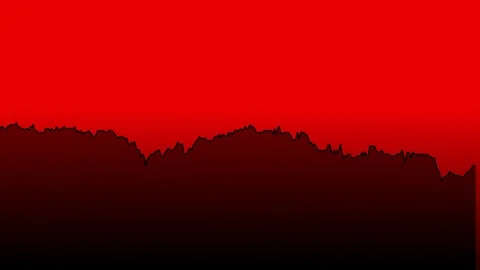
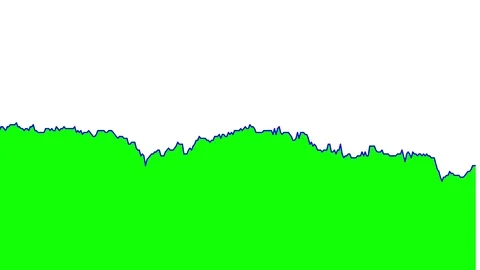
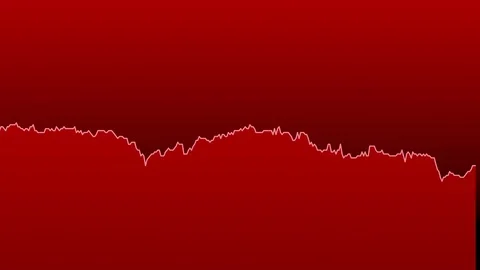
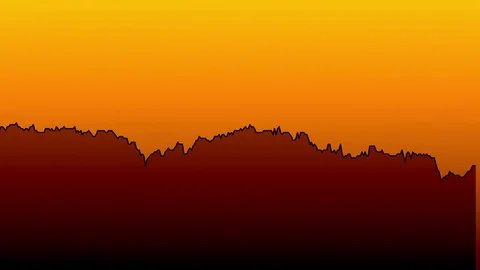
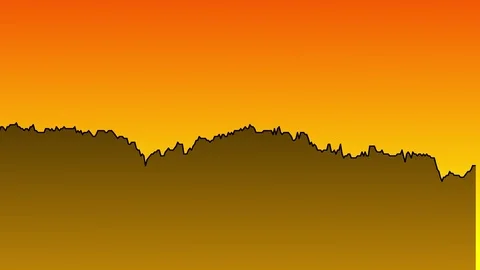
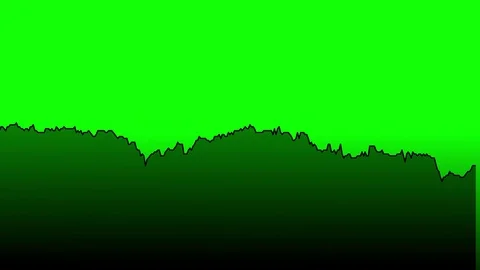
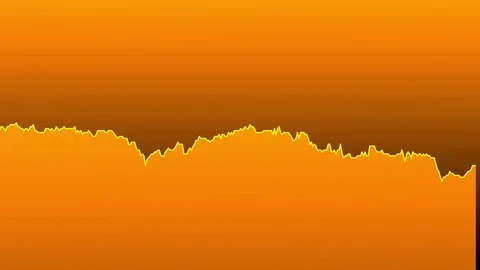
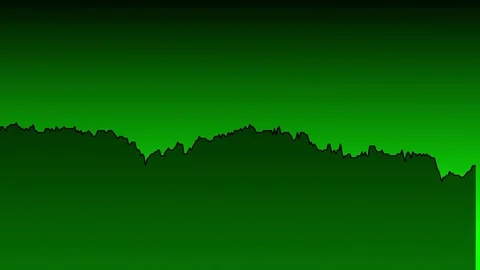
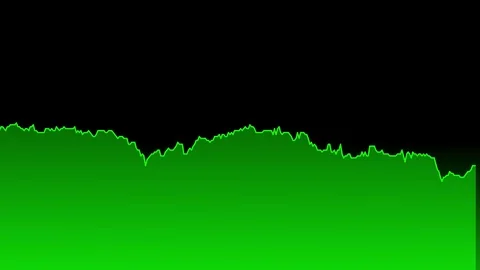
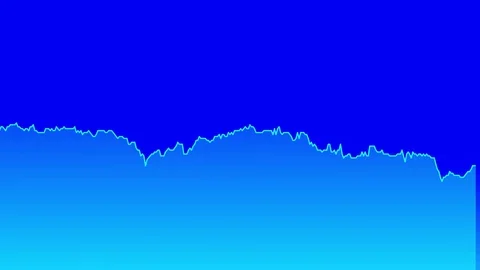
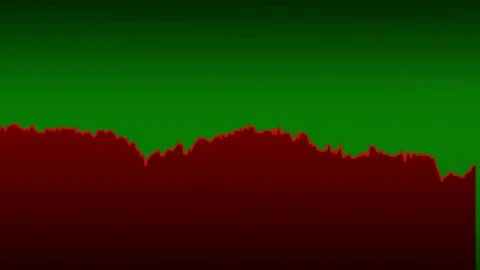
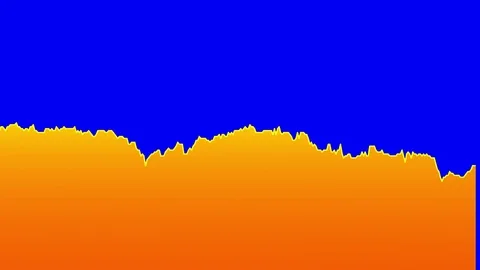
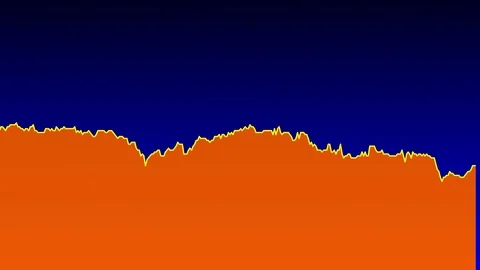
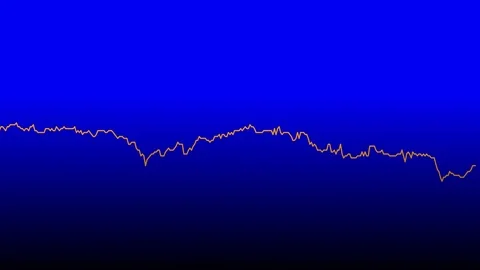
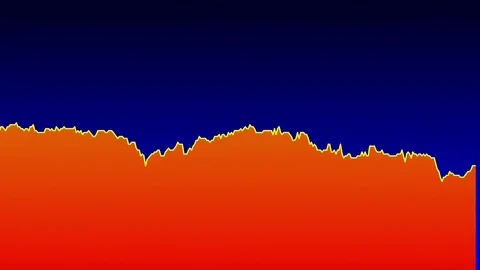
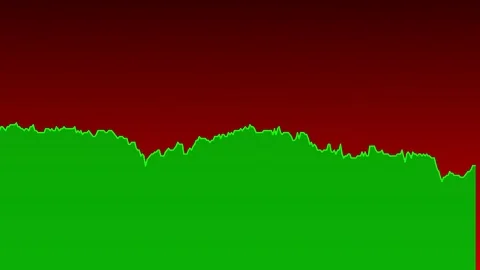
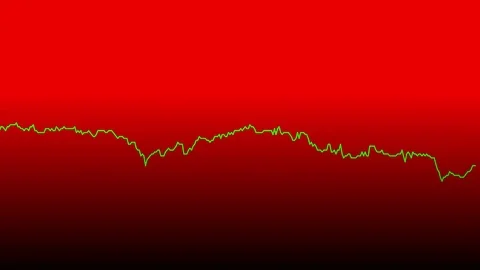
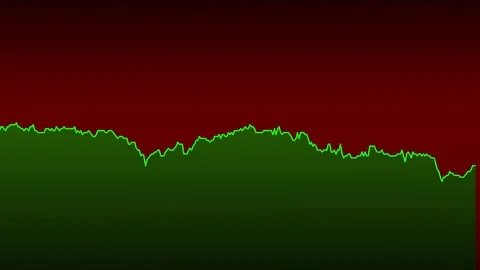
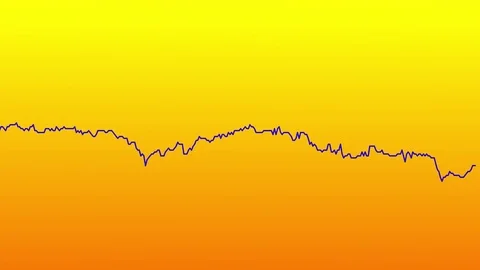
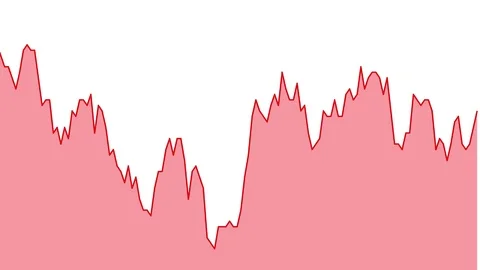
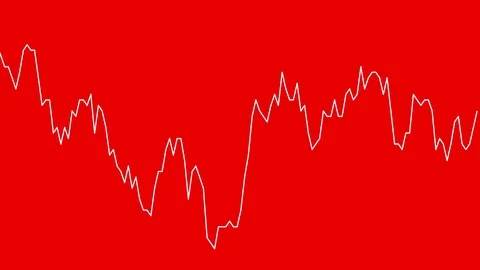
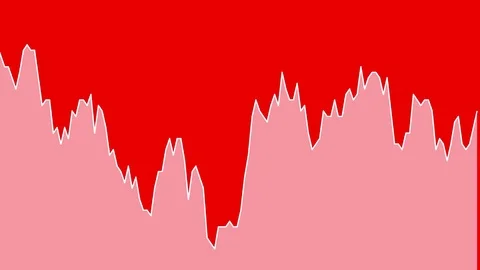
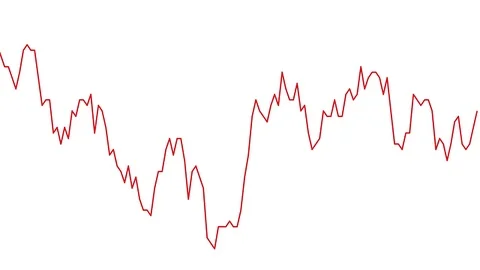
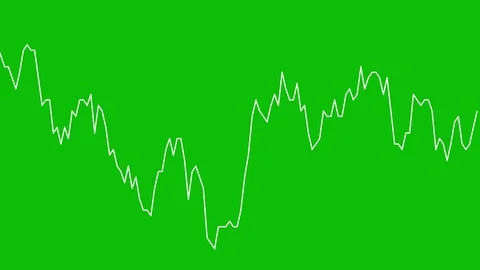
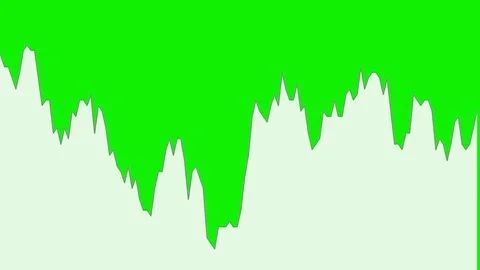
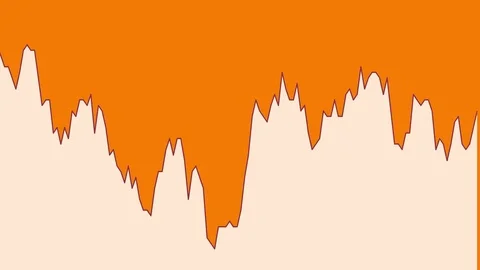
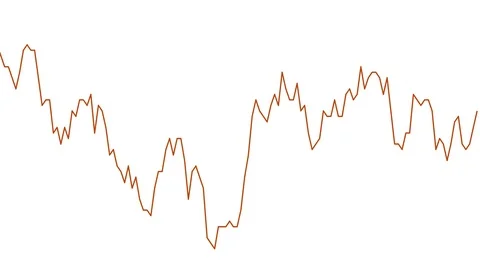
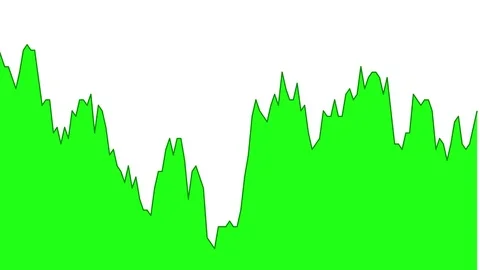
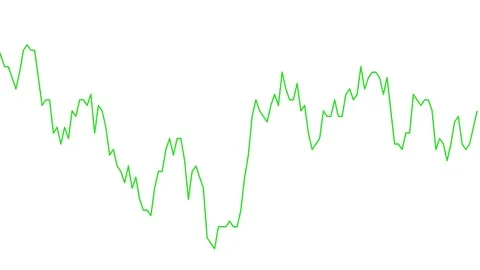
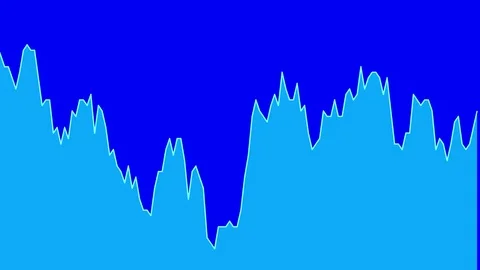
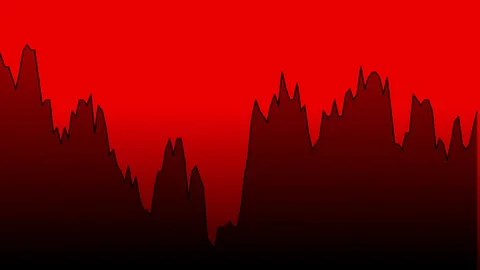
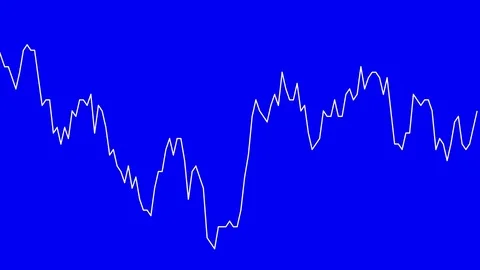
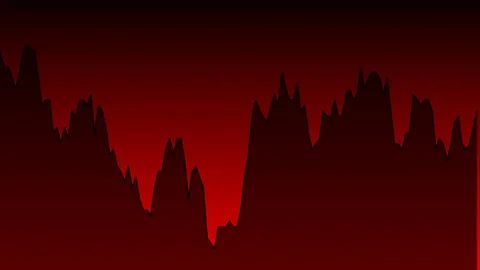
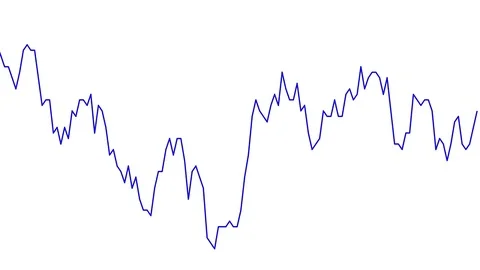
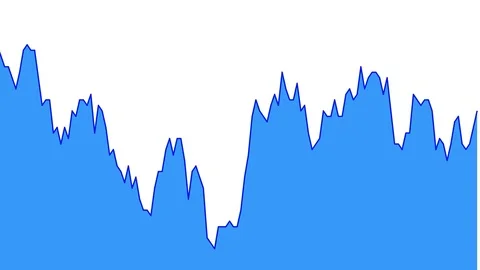
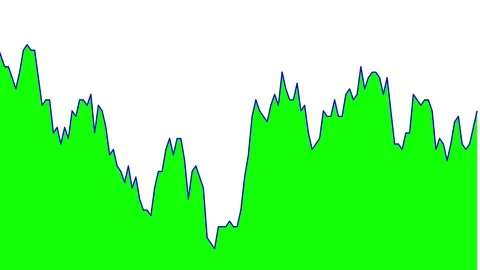
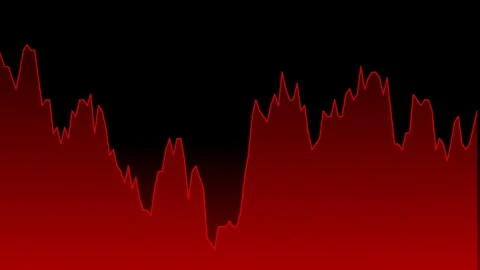
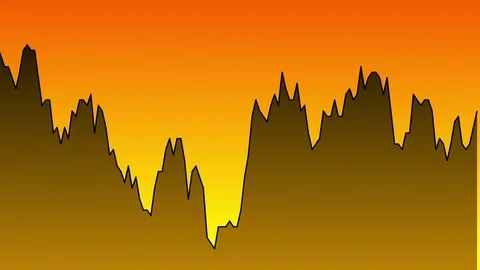
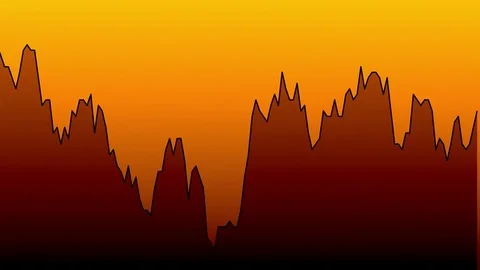
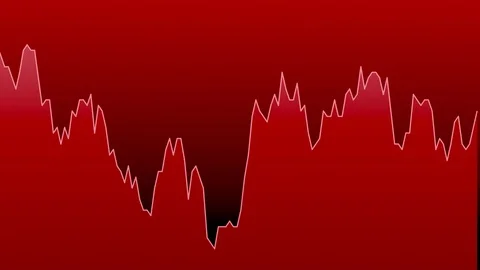
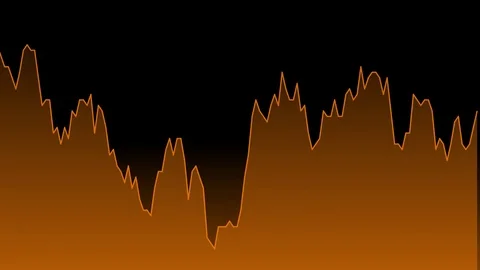
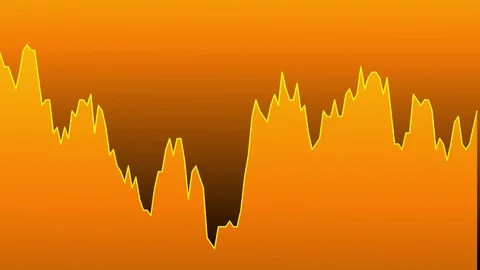
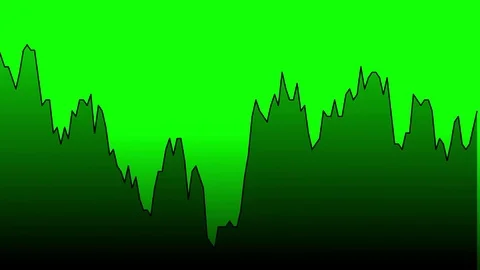
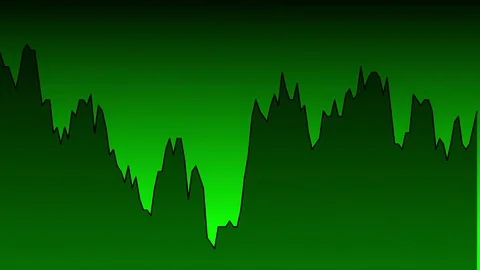
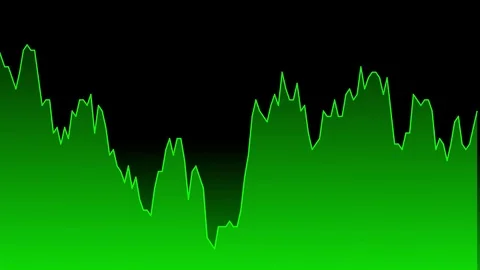
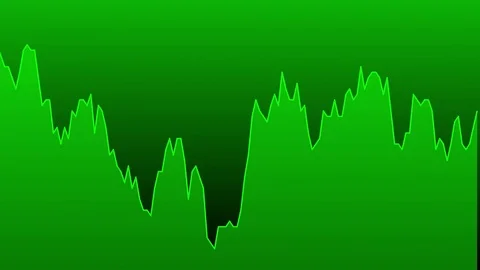
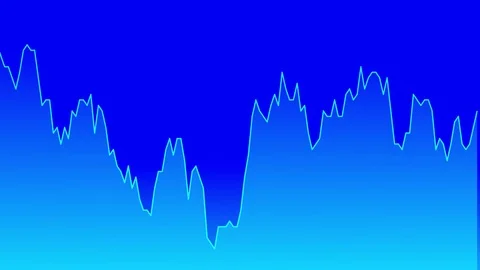
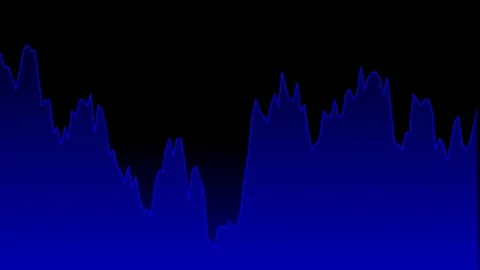
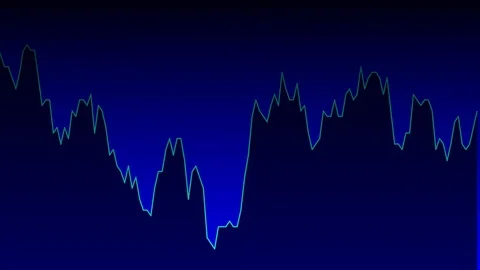
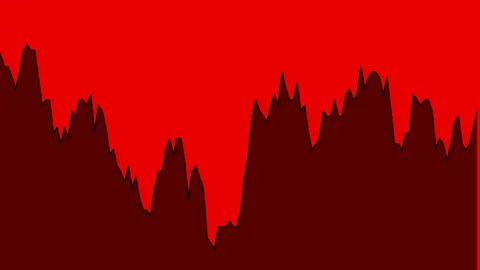
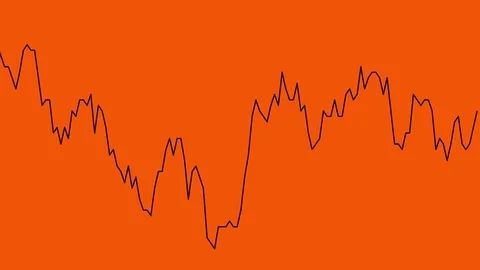
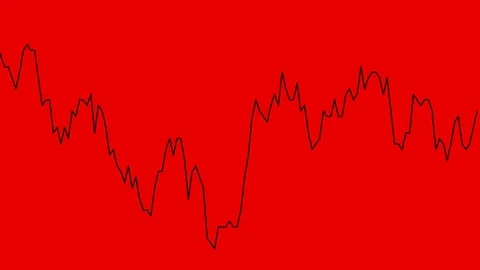
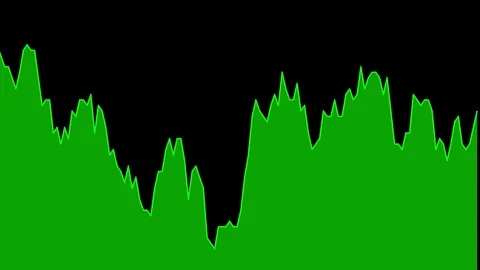
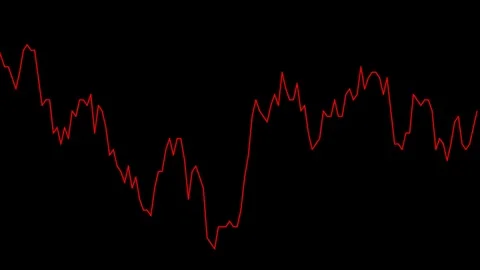
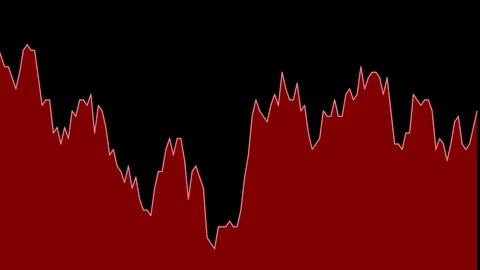
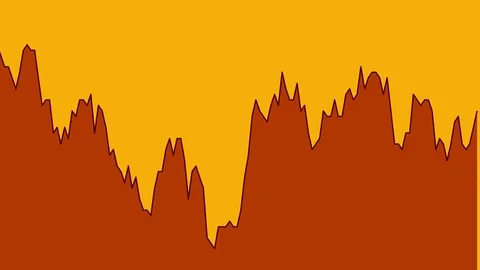
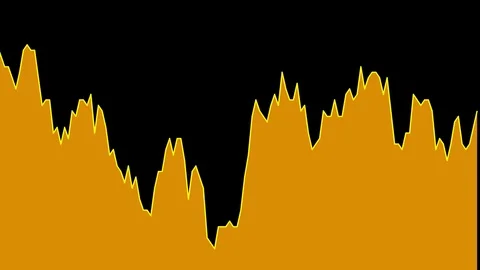
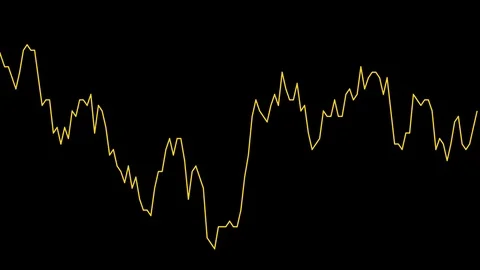
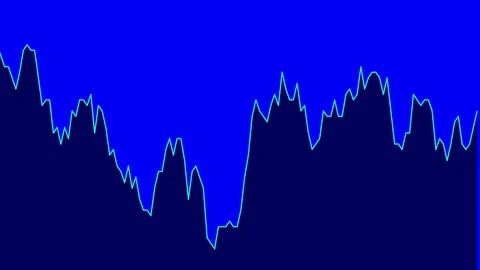
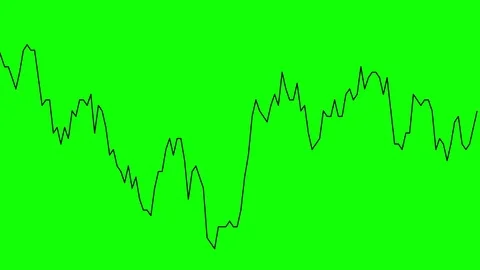
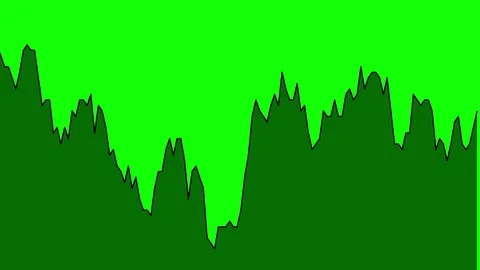
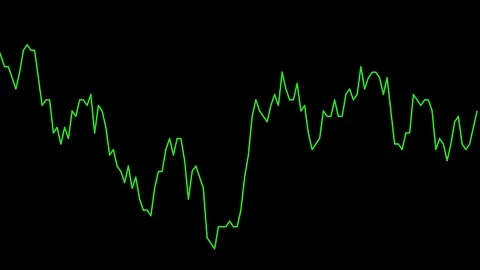
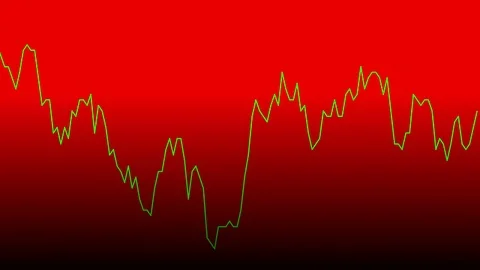
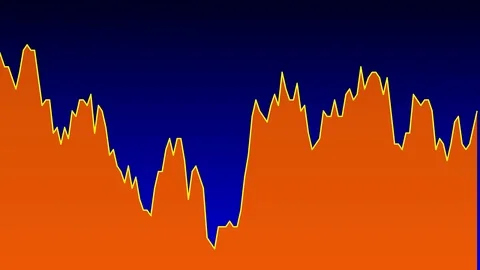
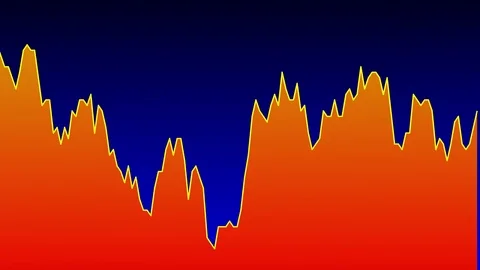
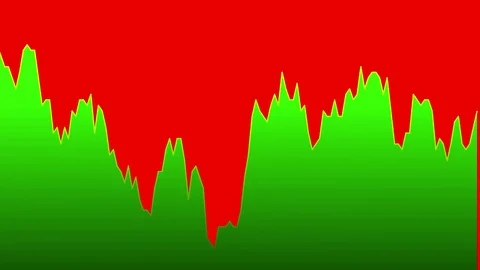
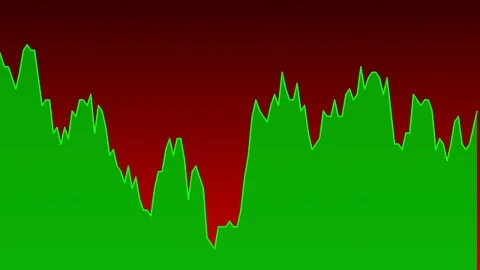
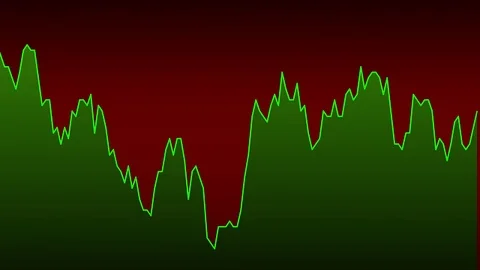
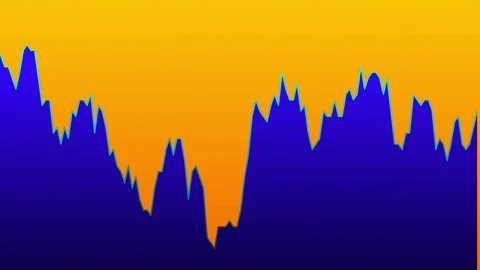
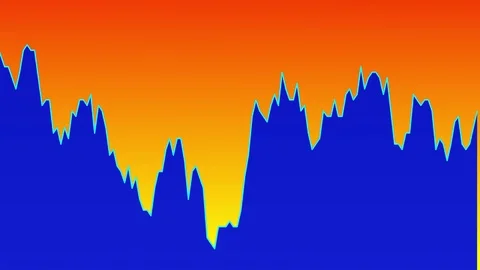
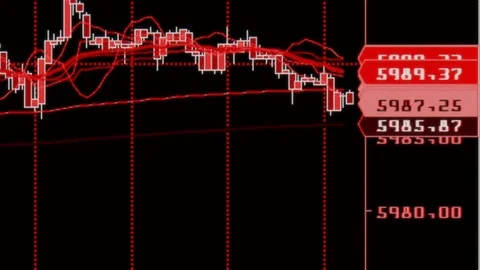
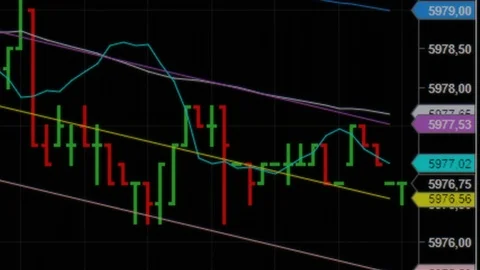
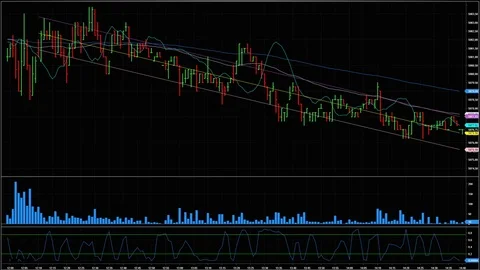
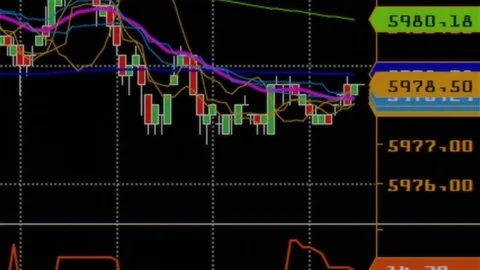
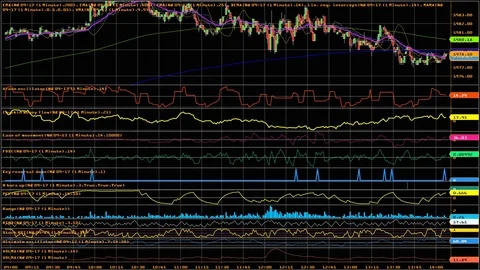
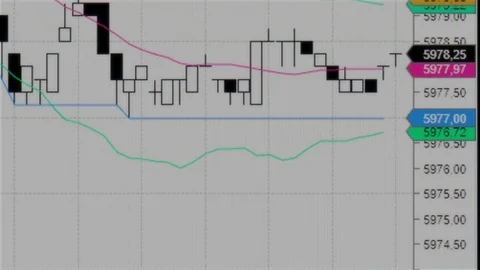
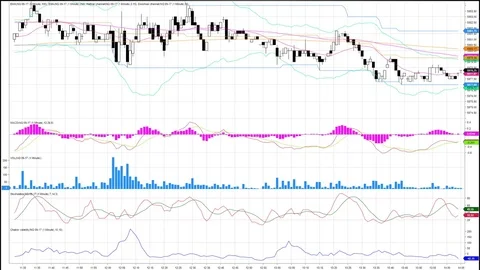
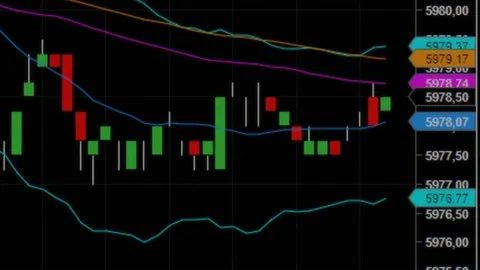
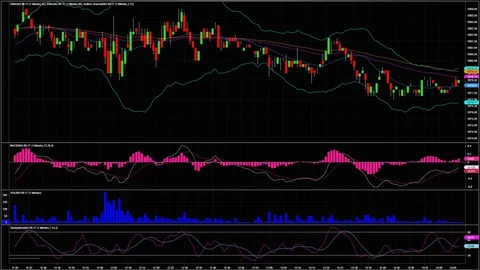
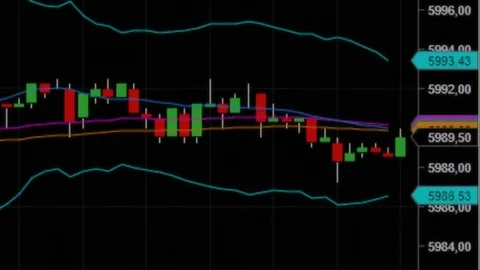
Technical traders use the price history of any asset, and the price patterns that form, as a basis for making trading decision and analysis. This is called technical analysis, a technique that uses the price chart of an asset as a key determinant in forecasting where the price will go next. Price charts are highly visual, showing where a stock price has been in the past, the price's current trajectory, how volatile the price movements are, and whether the stock has a lot or little interest in it.
Stock charts 動画素材


Stock charts 写真素材


Stock charts イラスト素材