Pause Media
Skip to main content
Pond5
動画
クリエイティブ動画
ニュースとアーカイブ動画
限定動画
縦長動画
VideoAI
VideoAI
音楽
音楽ホーム
サウンドエフェクト
サウンドエフェクトホーム
詳細
他のメディアの種類を表示
After Effects
After Effectsホーム
写真
写真ホーム
イラスト
イラストホーム
Photoshop PSD
Photoshop PSDホーム
イラスト
動画
クリエイティブ動画
ニュースとアーカイブ動画
限定動画
縦長動画
音楽素材
サウンドエフェクト
After Effects
写真
イラスト
Photoshop PSD
Clear Search
Visual Similarity Search
検索
検索
ja
Deutsch -
de
English -
en
Español -
es
Français -
fr
Italiano -
it
Nederlands -
nl
Português -
pt
Русский -
ru
한국인 -
ko
日本語 -
ja
简体中文 -
zh
お問い合わせ
価格
0
Get more credits
今すぐ登録
ログイン
今すぐ登録
ログイン
0
Mobile navigation
whaledesigninfographic
Thailand
853 イラスト
共有
emailIcon
Created with Sketch.
Email
リンクをコピー
Facebook
twitterIcon
Created with Sketch.
Twitter
詳細
少なく
当社について
情報がありません
2021からPond5に寄稿
キーワード
person
business
text
man
writer
social
marketing
people
professional
create
digital
cartoon
design
writing
banner
ホーム
Browse artists イラスト
イラスト
コレクション
イラスト
すべて表示
The Mbti Myers-Briggs Personality Type Indicator Use In Psychology. Mbti Is..
類似する素材を表示
The Vector Infographic Diagram Of The Linear Economy Concept Has 5 Dimensions
類似する素材を表示
The Vector Illustration Of The Brand Strategy Venn Diagram Has Vison, Image A
類似する素材を表示
Online Advertising Pricing Matrix Diagram Is Online Advertising Payment Model
類似する素材を表示
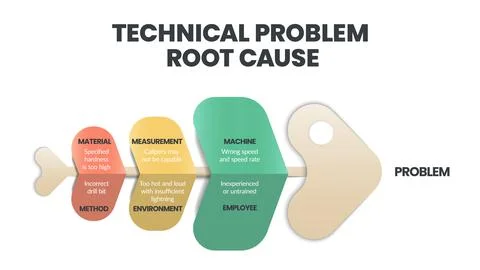
Technical Problem Root Cause Infographic. A Fishbone Or Cause And Effect Or I
類似する素材を表示
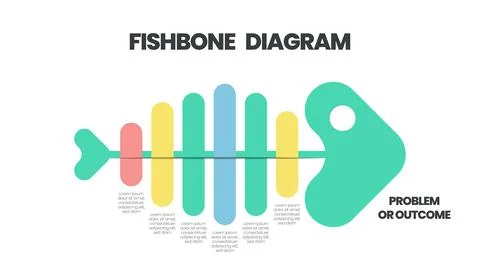
The Vector Featured A Fish Skeleton. A Fishbone Presentation Is A Cause-And-
類似する素材を表示
The Aida (Attention, Interest, Desire, And Action) Is A Triangle Vector Has F
類似する素材を表示
A Vector Illustration Of Company Brand Essence Exists At The Core Of A Compan
類似する素材を表示
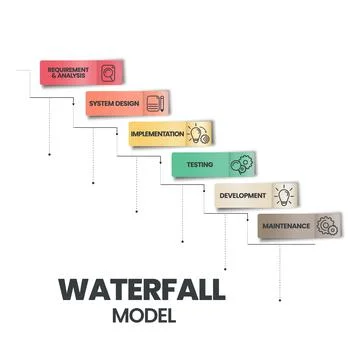
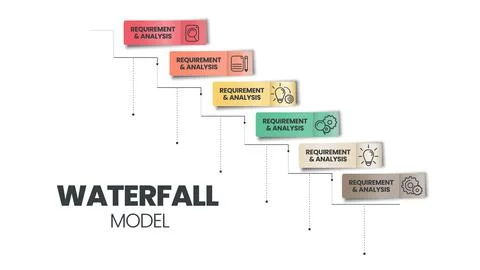
The Waterfall Model Infographic Vector Is Used In Software Engineering Or Sof
類似する素材を表示
Swot Analysis Infographic With Icons Template Has 4 Steps Such As Strengths,
類似する素材を表示
The Iceberg Model Of Ehlers-Danlos Syndromes (Eds) And Hypermobility Spectrum
類似する素材を表示
Increase Direct Selling Time Infographic Template Has 2 Column To Analyze Suc
類似する素材を表示
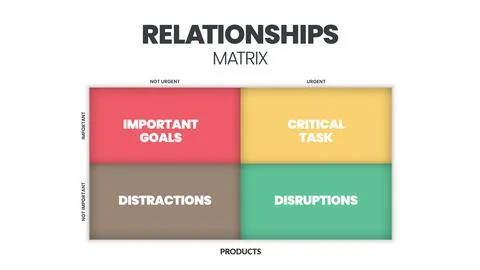
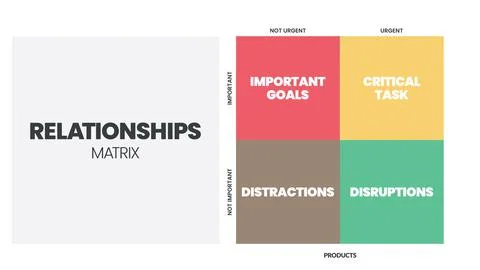
Relationships Matrix Infographic Presentation Is Vector Illustration In Four
類似する素材を表示
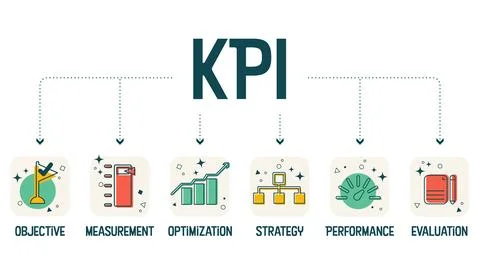
Kpi Or Key Performance Indicator Vector Illustration Banner
類似する素材を表示
The Vector Illustration In A Concept Of Pyramid Of Critical Analysis And Thin
類似する素材を表示
Who Are Selling To Infographic Has 7 Steps To Analyze Such As Industry, Size
類似する素材を表示
Waterfall, Agile And Change Control Infographic Triangle Pyramid Diagram Te..
類似する素材を表示
Customer Journey Maps Infographic Has 6 Steps To Analyse Such As Awareness, E
類似する素材を表示
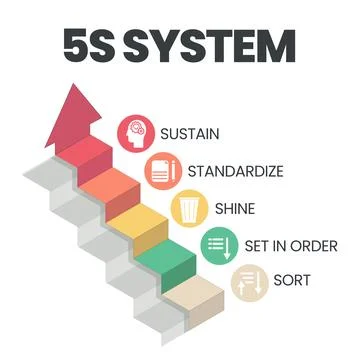
A Vector Banner Of The 5S System
類似する素材を表示
The 3P Sustainability Diagram Has 3 Elements: People, Planet, And Profit. The
類似する素材を表示
The Waterfall Model Infographic Vector Is Used In Software Engineering Or Sof
類似する素材を表示
4 Types Of Innovation Matrix Infographic Presentation Is A Vector Illustration I
類似する素材を表示
Blue And Red Ocean Strategy Concept Presentation Vector Infographic Element
類似する素材を表示
Happy Chemistry Infographic Has 4 Types Of Chemical Hormones Such As Oxytocin
類似する素材を表示
The Vector Illustration Of The Brand Strategy Venn Diagram Has Vison, Image A
類似する素材を表示
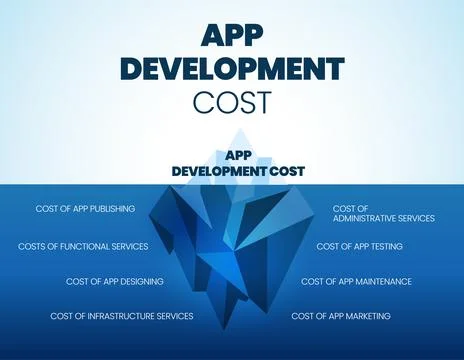
A Vector Of App Development Costs Iceberg Model Has Hidden Costs Underwater
類似する素材を表示
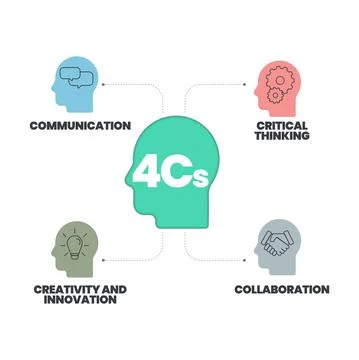
4Cs Of 21St Century Learning Analysis Infographic Has 6 Steps To Analyse Such
類似する素材を表示
Crm Or Customer Relationship Management Banner Concept Has 4 Steps To Analyze
類似する素材を表示
The 3P Sustainability Diagram Has 3 Elements: People, Planet, And Profit. The
類似する素材を表示
A Cultural Iceberg Templates On The Surface Can Be Observed. But Underwater B
類似する素材を表示
Flower Tone Colour Schemes Ideas.color Palettes Are Trends Combinations And P
類似する素材を表示
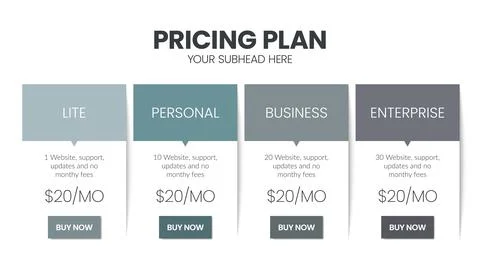
Modern Creative Pricing Subscription Plan Table Template With Minimal Line Ic
類似する素材を表示
4 Stages Of Communication Styles Infographics Template Banner With Icons Ha..
類似する素材を表示
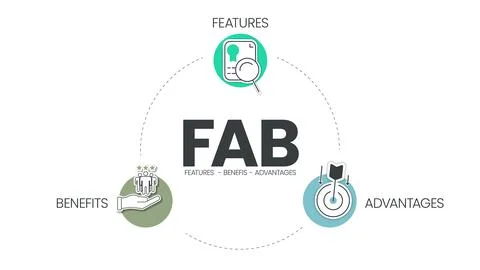
A Fab Analysis Describes The Features, Advantages And Benefits Of A Product,
類似する素材を表示
Jungle Tone Colour Schemes Ideas.color Palettes Are Trends Combinations And P
類似する素材を表示
The Vector Iceberg Model Of Critical Realism (Cr) Is A Philosophical Social S
類似する素材を表示
1950S Colour Schemes Ideas. Color Trends Combinations And Palette Guide. Exam
類似する素材を表示
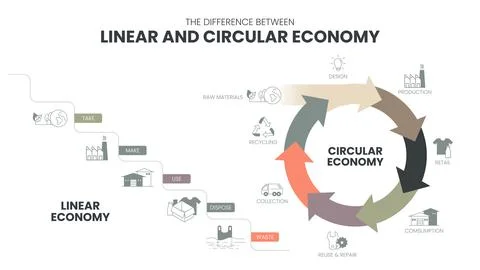
The Vector Infographic Diagram Of The Difference Between The Circular Economy
類似する素材を表示
Pareto Principle Is An 80 20 Rule Analysis Diagram. The Illustration Is A Pie
類似する素材を表示
Jungle Tone Colour Schemes Ideas.color Palettes Are Trends Combinations And P
類似する素材を表示
The Vector Infographic Illustration In The 7 Green Waste Reduction Concept Ha
類似する素材を表示
Halloween Theme Color Palettes Or Color Schemes Are Trends Combinations And P
類似する素材を表示
Blue And Red Ocean Strategy Concept Presentation Vector Infographic Element
類似する素材を表示
Relationships Matrix Infographic Presentation Is Vector Illustration In Four
類似する素材を表示
7 Stages Of Delegation Infographic Vector Template With Icons Symbol Has Te..
類似する素材を表示
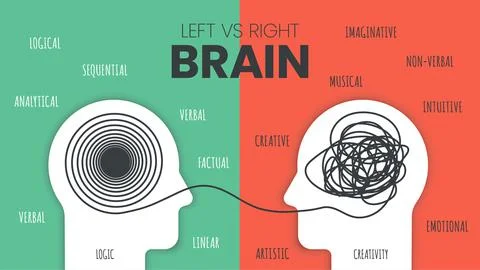
Left Brain Vs. Right Brain Dominance Infographic Template. How The Human Brai
類似する素材を表示
1950S Colour Schemes Ideas. Color Trends Combinations And Palette Guide. Exam
類似する素材を表示
Childhood Trauma Infographic Presentation Template With Icon Has 3 Symptons..
類似する素材を表示
戻る
1...
ページ1に移動
12
12ページ
13
ページ13に移動
14
ページ14に移動
15
ページ15に移動
16
ページ16に移動
次へ
最新のイラスト
すべて表示
Search results item placeholder
Search results item placeholder
Search results item placeholder
Search results item placeholder
Search results item placeholder
Search results item placeholder
Deutsch
English
Español
Français
Italiano
Nederlands
Português
Русский
한국인
简体中文
x
#{title}
#{text}
Close