Pause Media
Skip to main content
Pond5
動画
クリエイティブ動画
ニュースとアーカイブ動画
限定動画
縦長動画
VideoAI
VideoAI
音楽
音楽ホーム
サウンドエフェクト
サウンドエフェクトホーム
詳細
他のメディアの種類を表示
After Effects
After Effectsホーム
写真
写真ホーム
イラスト
イラストホーム
Photoshop PSD
Photoshop PSDホーム
イラスト
動画
クリエイティブ動画
ニュースとアーカイブ動画
限定動画
縦長動画
音楽素材
サウンドエフェクト
After Effects
写真
イラスト
Photoshop PSD
Clear Search
Visual Similarity Search
検索
検索
ja
Deutsch -
de
English -
en
Español -
es
Français -
fr
Italiano -
it
Nederlands -
nl
Português -
pt
Русский -
ru
한국인 -
ko
日本語 -
ja
简体中文 -
zh
お問い合わせ
価格
0
Get more credits
今すぐ登録
ログイン
今すぐ登録
ログイン
0
Mobile navigation
whaledesigninfographic
Thailand
853 イラスト
共有
emailIcon
Created with Sketch.
Email
リンクをコピー
Facebook
twitterIcon
Created with Sketch.
Twitter
詳細
少なく
当社について
情報がありません
2021からPond5に寄稿
キーワード
person
business
text
man
writer
social
marketing
people
professional
create
digital
cartoon
design
writing
banner
ホーム
Browse artists イラスト
イラスト
コレクション
イラスト
すべて表示
A Vector And Illustration In A Job Market Iceberg Model Have 25 Percent Of Po
類似する素材を表示
Bright Tone Colour Schemes Ideas. Color Palettes Are Trends Combinations And
類似する素材を表示
5 R Of Brand Roi Strategy Infographic Diagram Banner With Icon Vector For P..
類似する素材を表示
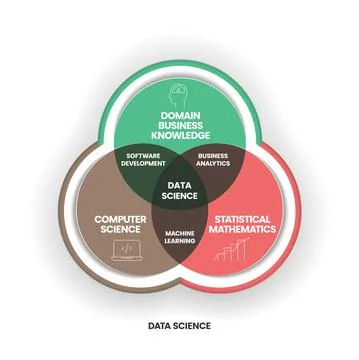
Data Science Concept Is Combining Domain, Business Knowledge, Computer Scienc
類似する素材を表示
Customer Centricity Venn Diagram Has Customer Journey, Customr Experience And
類似する素材を表示
Lencioni's 5 Dysfunctions Of A Team Infographic Template Has 5 Level To Analy
類似する素材を表示
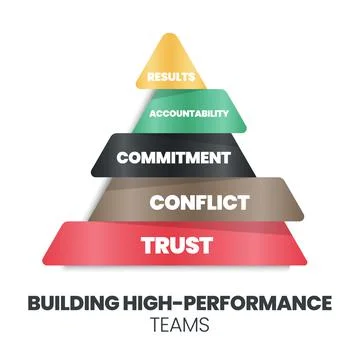
A Pyramid Of Building High-Performance Teams Concept Has Trust, Conflict, Com
類似する素材を表示
Creative Minimal Business Monthly 2023 Calendar Template Vector. Desk, Wall..
類似する素材を表示
Wedding Color Scheme. Color Trends Combinations And Palette Guide. Example Of
類似する素材を表示
Cpvai Model Analysis Infographic With Icon Template Has 5 Steps Such As Colle
類似する素材を表示
A Vector And Illustration In A Job Market Iceberg Model Have 25 Percent Of Po
類似する素材を表示
5W1H Cause And Effect Diagram Infographic Template Has 6 Steps To Analyze Suc
類似する素材を表示
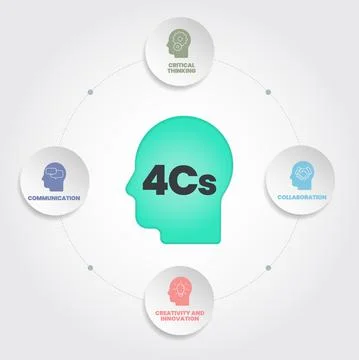
4Cs Of 21St Century Learning Analysis Infographic Has 6 Steps To Analyse Such
類似する素材を表示
Marketing Targeting Infographic Presentation Template With Icons Has 4 Step..
類似する素材を表示
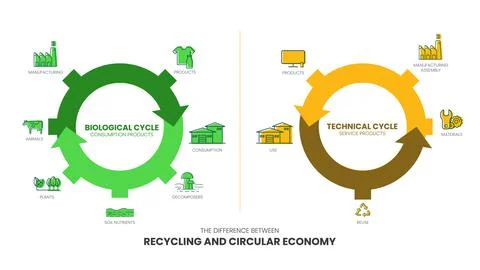
The Vector Infographic Diagram Of The Difference Between The Circular Economy
類似する素材を表示
Spring Color Palettes Or Color Schemes Are Trends Combinations And Palette Gu
類似する素材を表示
A Vector Illustration Of Company Brand Essence Exists At The Core Of A Compan
類似する素材を表示
Summer Theme Color Palettes Or Color Schemes Are Trends Combinations And Pale
類似する素材を表示
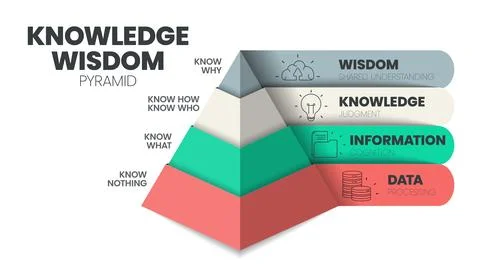
Knowledge Wisdom Hierarchy Infographic Template With Icon Has Wisdom (Share..
類似する素材を表示
Cost Per Action (Cpa) Matrix Diagram Is A Advertising Payment Model , Has 4 S
類似する素材を表示
Mental Or Emotional Health Infographic Presentation Template To Prevent Fro..
類似する素材を表示
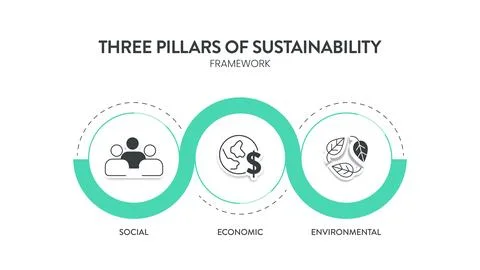
Three Pillars Of Sustainable Development Framework Diagram Chart Infographi..
類似する素材を表示
The Total Cost Of Ownership (Tco) Is An Iceberg Model Concept For Cost Price
類似する素材を表示
The Vector Banner With Icons In Viral Loop Concept Has 4 Steps To Analyze Suc
類似する素材を表示
Chart Template
類似する素材を表示
Business Process Improvement (Bpi) Strategy Infographic Diagram Presentatio..
類似する素材を表示
Agile And Waterfall Are Two Distinctive Methodologies Of Processes To Complet
類似する素材を表示
Brand Strategy (Who, What, How, Why) Infographic Presentation Template With..
類似する素材を表示
The Cost Of Device Parts Iceberg Concept Is In A Vector Illustration And Info
類似する素材を表示
The Vector Infographic Illustration In The 7 Green Waste Reduction Concept Ha
類似する素材を表示
The Vector Illustration In A Concept Of Pyramid Of Critical Analysis And Thin
類似する素材を表示
5W1H Analysis Diagram Vector Is Cause And Effect Flowcharts, It Helps To Find
類似する素材を表示
4 Stages Of Communication Styles Infographics Template Banner With Icons Ha..
類似する素材を表示
Traditional Funnel Compare With Product-Led Funnel Model Infographic Templa..
類似する素材を表示
A Vector Banner Of The 5S System Is Organizing Spaces Industry Performed Effe
類似する素材を表示
The Iceberg Model Vector And Illustration In The Hidden Costs Of Injuries Hav
類似する素材を表示
4 Types Of Innovation Matrix Infographic Presentation
類似する素材を表示
The Vector Banner With Icons In Viral Loop Concept Has 4 Steps To Analyze Suc
類似する素材を表示
4Ps Model Of Marketing Mix Infographic Presenation Template With Icons Has 4
類似する素材を表示
The Plan-Do-Check-Act Procedure Or Deming Cycle Is A Four-Step Model For Rese
類似する素材を表示
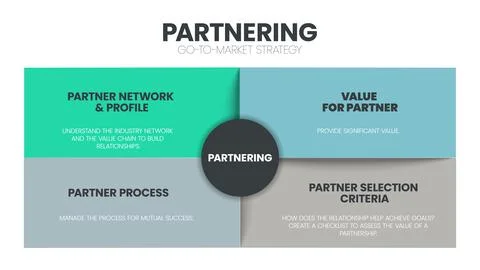
Partnering Analysis Infographic Template Has 4 Steps To Analyze Such As Partn
類似する素材を表示
Content Creator Eps Vector
類似する素材を表示
Chart Template 2022
類似する素材を表示
The Vector Banner With Icons In 3Pl Concept Has 3 Steps To Analyze Such As Lo
類似する素材を表示
The Hidden Cost Iceberg Of The 30 Percent Of The Purchase Price Is Underwater
類似する素材を表示
Minimum Viable Products (Mvp) And Build-Measure-Learn Loops Infographic Templ
類似する素材を表示
The 3P Sustainability Diagram Has 3 Elements: People, Planet, And Profit. The
類似する素材を表示
Matrix Diagram Of 4 Stages Of Competence Into A Vector Chart Infographic For
類似する素材を表示
戻る
1...
ページ1に移動
6
6ページ
7
ページ7に移動
8
ページ8に移動
9
ページ9に移動
10
ページ10に移動
次へ
最新のイラスト
すべて表示
Search results item placeholder
Search results item placeholder
Search results item placeholder
Search results item placeholder
Search results item placeholder
Search results item placeholder
Deutsch
English
Español
Français
Italiano
Nederlands
Português
Русский
한국인
简体中文
x
#{title}
#{text}
Close